Immigrants from Germany vs Ethiopian College, 1 year or more
COMPARE
Immigrants from Germany
Ethiopian
College, 1 year or more
College, 1 year or more Comparison
Immigrants from Germany
Ethiopians
60.3%
COLLEGE, 1 YEAR OR MORE
76.1/ 100
METRIC RATING
152nd/ 347
METRIC RANK
62.9%
COLLEGE, 1 YEAR OR MORE
98.8/ 100
METRIC RATING
77th/ 347
METRIC RANK
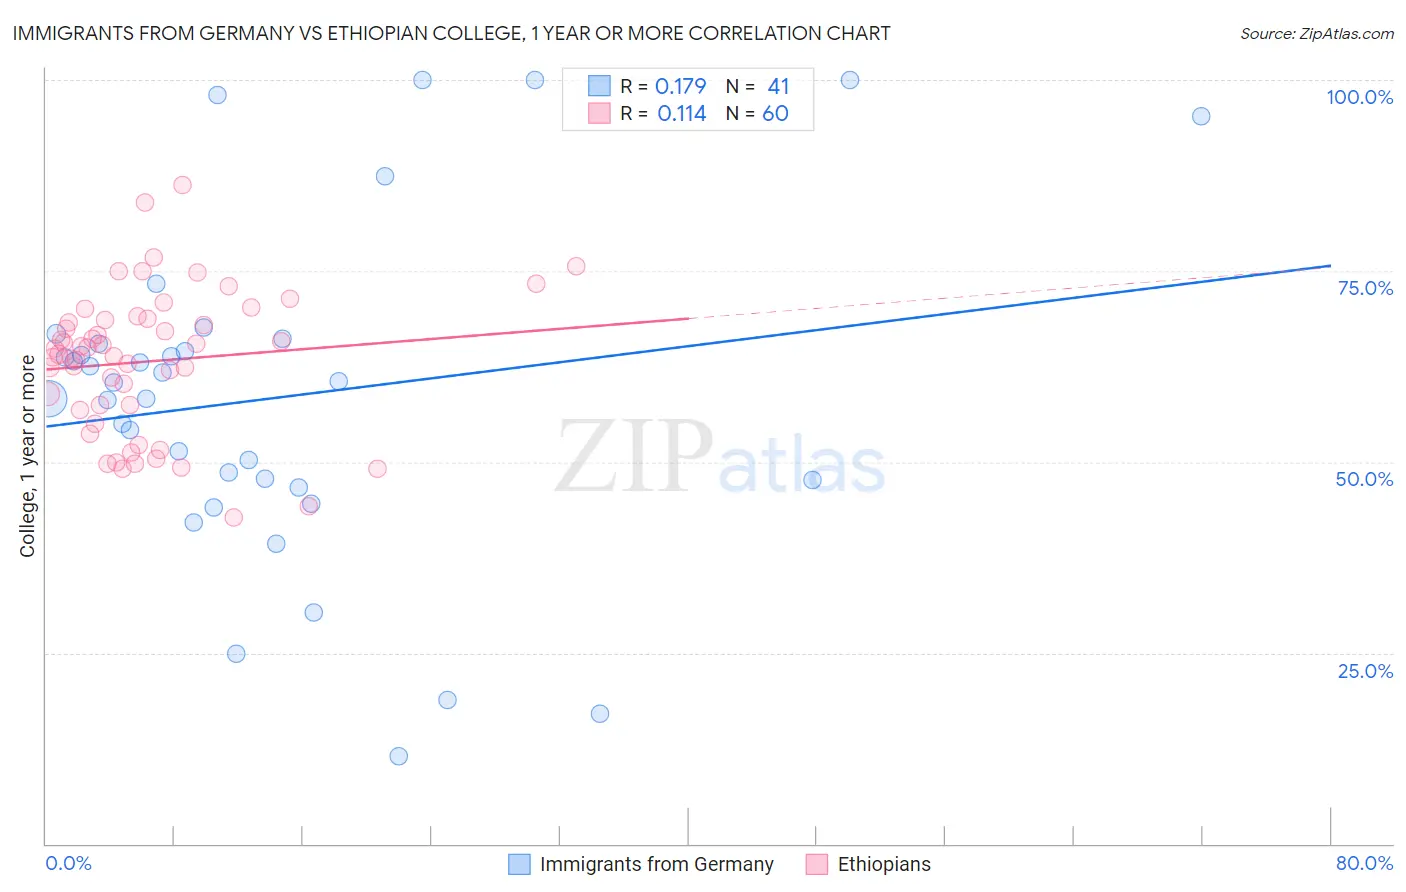
Immigrants from Germany vs Ethiopian College, 1 year or more Correlation Chart
The statistical analysis conducted on geographies consisting of 463,883,930 people shows a poor positive correlation between the proportion of Immigrants from Germany and percentage of population with at least college, 1 year or more education in the United States with a correlation coefficient (R) of 0.179 and weighted average of 60.3%. Similarly, the statistical analysis conducted on geographies consisting of 223,259,495 people shows a poor positive correlation between the proportion of Ethiopians and percentage of population with at least college, 1 year or more education in the United States with a correlation coefficient (R) of 0.114 and weighted average of 62.9%, a difference of 4.3%.
College, 1 year or more Correlation Summary
| Measurement | Immigrants from Germany | Ethiopian |
| Minimum | 11.4% | 42.8% |
| Maximum | 100.0% | 86.2% |
| Range | 88.6% | 43.5% |
| Mean | 58.4% | 63.2% |
| Median | 60.4% | 64.5% |
| Interquartile 25% (IQ1) | 47.2% | 57.1% |
| Interquartile 75% (IQ3) | 65.8% | 68.7% |
| Interquartile Range (IQR) | 18.6% | 11.6% |
| Standard Deviation (Sample) | 21.6% | 9.3% |
| Standard Deviation (Population) | 21.4% | 9.2% |
Similar Demographics by College, 1 year or more
Demographics Similar to Immigrants from Germany by College, 1 year or more
In terms of college, 1 year or more, the demographic groups most similar to Immigrants from Germany are Immigrants from Sudan (60.4%, a difference of 0.13%), Albanian (60.4%, a difference of 0.13%), Sierra Leonean (60.2%, a difference of 0.14%), Kenyan (60.5%, a difference of 0.22%), and Brazilian (60.5%, a difference of 0.22%).
| Demographics | Rating | Rank | College, 1 year or more |
| Slavs | 81.1 /100 | #145 | Excellent 60.6% |
| Scottish | 80.2 /100 | #146 | Excellent 60.5% |
| Immigrants | Kenya | 79.1 /100 | #147 | Good 60.5% |
| Kenyans | 79.0 /100 | #148 | Good 60.5% |
| Brazilians | 79.0 /100 | #149 | Good 60.5% |
| Immigrants | Sudan | 77.8 /100 | #150 | Good 60.4% |
| Albanians | 77.8 /100 | #151 | Good 60.4% |
| Immigrants | Germany | 76.1 /100 | #152 | Good 60.3% |
| Sierra Leoneans | 74.1 /100 | #153 | Good 60.2% |
| Sudanese | 73.0 /100 | #154 | Good 60.2% |
| Moroccans | 72.9 /100 | #155 | Good 60.2% |
| Finns | 72.9 /100 | #156 | Good 60.2% |
| Immigrants | Armenia | 68.8 /100 | #157 | Good 60.0% |
| English | 67.2 /100 | #158 | Good 60.0% |
| Immigrants | Iraq | 67.0 /100 | #159 | Good 60.0% |
Demographics Similar to Ethiopians by College, 1 year or more
In terms of college, 1 year or more, the demographic groups most similar to Ethiopians are Paraguayan (62.9%, a difference of 0.0%), Immigrants from Lebanon (62.9%, a difference of 0.020%), Northern European (62.9%, a difference of 0.030%), Lithuanian (62.9%, a difference of 0.070%), and Armenian (63.0%, a difference of 0.10%).
| Demographics | Rating | Rank | College, 1 year or more |
| Argentineans | 99.2 /100 | #70 | Exceptional 63.2% |
| Immigrants | Canada | 99.1 /100 | #71 | Exceptional 63.1% |
| Egyptians | 99.0 /100 | #72 | Exceptional 63.1% |
| Immigrants | Moldova | 99.0 /100 | #73 | Exceptional 63.0% |
| Immigrants | North America | 99.0 /100 | #74 | Exceptional 63.0% |
| Armenians | 98.9 /100 | #75 | Exceptional 63.0% |
| Paraguayans | 98.8 /100 | #76 | Exceptional 62.9% |
| Ethiopians | 98.8 /100 | #77 | Exceptional 62.9% |
| Immigrants | Lebanon | 98.8 /100 | #78 | Exceptional 62.9% |
| Northern Europeans | 98.8 /100 | #79 | Exceptional 62.9% |
| Lithuanians | 98.8 /100 | #80 | Exceptional 62.9% |
| Laotians | 98.7 /100 | #81 | Exceptional 62.8% |
| Immigrants | Bolivia | 98.7 /100 | #82 | Exceptional 62.8% |
| Immigrants | Argentina | 98.6 /100 | #83 | Exceptional 62.8% |
| Immigrants | England | 98.6 /100 | #84 | Exceptional 62.8% |