Immigrants from Lithuania vs Aleut Master's Degree
COMPARE
Immigrants from Lithuania
Aleut
Master's Degree
Master's Degree Comparison
Immigrants from Lithuania
Aleuts
18.5%
MASTER'S DEGREE
99.9/ 100
METRIC RATING
54th/ 347
METRIC RANK
11.8%
MASTER'S DEGREE
0.1/ 100
METRIC RATING
286th/ 347
METRIC RANK
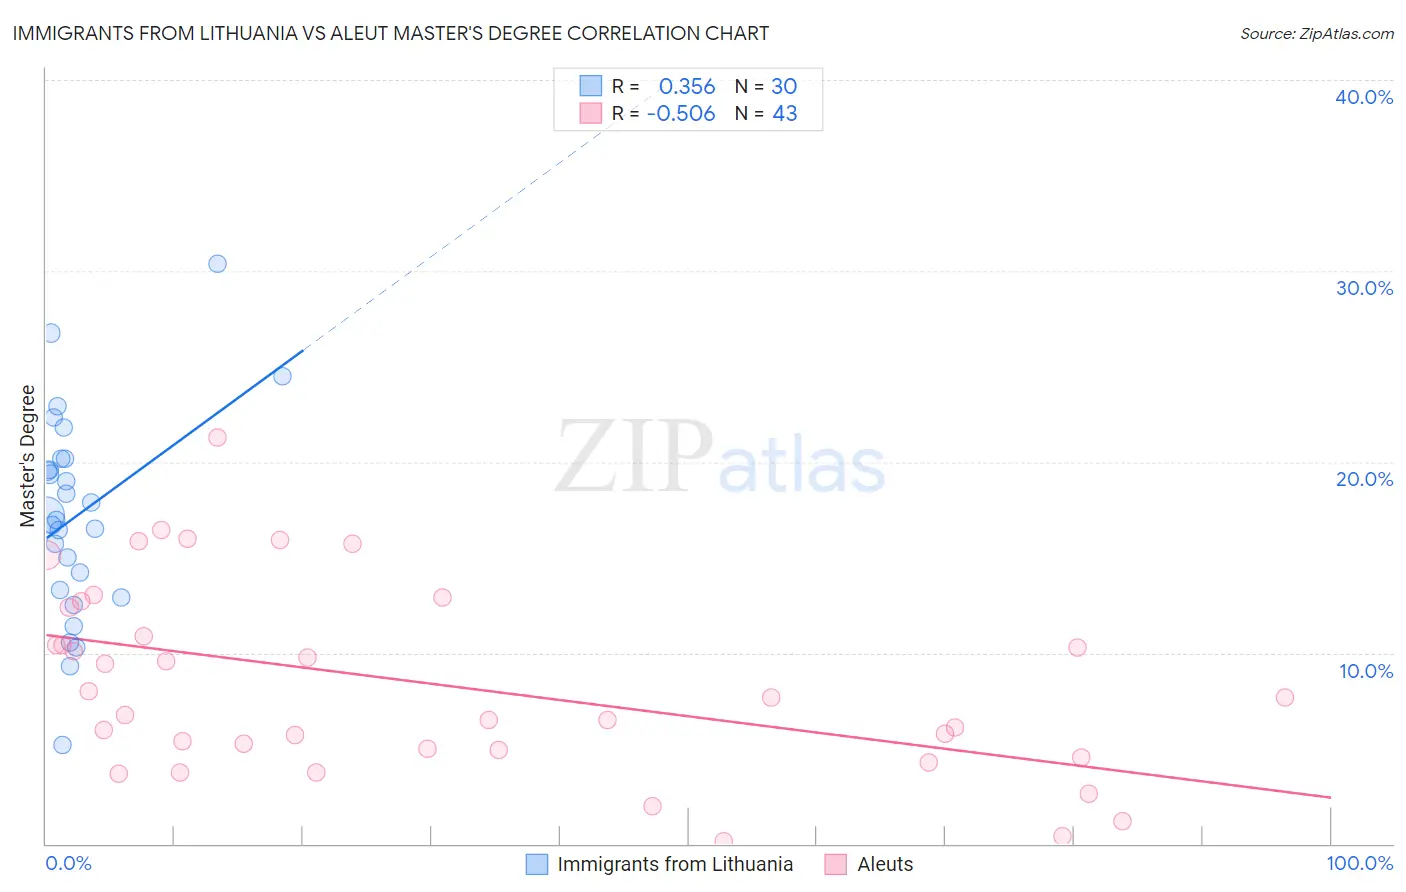
Immigrants from Lithuania vs Aleut Master's Degree Correlation Chart
The statistical analysis conducted on geographies consisting of 117,722,731 people shows a mild positive correlation between the proportion of Immigrants from Lithuania and percentage of population with at least master's degree education in the United States with a correlation coefficient (R) of 0.356 and weighted average of 18.5%. Similarly, the statistical analysis conducted on geographies consisting of 61,771,787 people shows a substantial negative correlation between the proportion of Aleuts and percentage of population with at least master's degree education in the United States with a correlation coefficient (R) of -0.506 and weighted average of 11.8%, a difference of 56.7%.
Master's Degree Correlation Summary
| Measurement | Immigrants from Lithuania | Aleut |
| Minimum | 5.1% | 0.13% |
| Maximum | 30.4% | 21.3% |
| Range | 25.3% | 21.2% |
| Mean | 17.2% | 8.4% |
| Median | 17.1% | 7.7% |
| Interquartile 25% (IQ1) | 13.3% | 4.9% |
| Interquartile 75% (IQ3) | 20.1% | 12.4% |
| Interquartile Range (IQR) | 6.8% | 7.5% |
| Standard Deviation (Sample) | 5.4% | 5.0% |
| Standard Deviation (Population) | 5.3% | 4.9% |
Similar Demographics by Master's Degree
Demographics Similar to Immigrants from Lithuania by Master's Degree
In terms of master's degree, the demographic groups most similar to Immigrants from Lithuania are Immigrants from Serbia (18.5%, a difference of 0.030%), Asian (18.4%, a difference of 0.26%), Immigrants from Czechoslovakia (18.5%, a difference of 0.31%), Immigrants from Kuwait (18.6%, a difference of 0.39%), and Immigrants from Asia (18.4%, a difference of 0.39%).
| Demographics | Rating | Rank | Master's Degree |
| Immigrants | Austria | 100.0 /100 | #47 | Exceptional 18.8% |
| Paraguayans | 100.0 /100 | #48 | Exceptional 18.8% |
| Estonians | 100.0 /100 | #49 | Exceptional 18.8% |
| Bulgarians | 100.0 /100 | #50 | Exceptional 18.8% |
| Immigrants | South Africa | 100.0 /100 | #51 | Exceptional 18.8% |
| Immigrants | Kuwait | 100.0 /100 | #52 | Exceptional 18.6% |
| Immigrants | Czechoslovakia | 99.9 /100 | #53 | Exceptional 18.5% |
| Immigrants | Lithuania | 99.9 /100 | #54 | Exceptional 18.5% |
| Immigrants | Serbia | 99.9 /100 | #55 | Exceptional 18.5% |
| Asians | 99.9 /100 | #56 | Exceptional 18.4% |
| Immigrants | Asia | 99.9 /100 | #57 | Exceptional 18.4% |
| Australians | 99.9 /100 | #58 | Exceptional 18.4% |
| Immigrants | Bulgaria | 99.9 /100 | #59 | Exceptional 18.3% |
| New Zealanders | 99.9 /100 | #60 | Exceptional 18.3% |
| Immigrants | Europe | 99.9 /100 | #61 | Exceptional 18.2% |
Demographics Similar to Aleuts by Master's Degree
In terms of master's degree, the demographic groups most similar to Aleuts are Immigrants from Haiti (11.8%, a difference of 0.20%), Immigrants from Nicaragua (11.8%, a difference of 0.35%), Immigrants from Honduras (11.8%, a difference of 0.36%), Guatemalan (11.7%, a difference of 0.44%), and Ottawa (11.9%, a difference of 0.54%).
| Demographics | Rating | Rank | Master's Degree |
| Immigrants | Belize | 0.2 /100 | #279 | Tragic 12.1% |
| Immigrants | Dominican Republic | 0.2 /100 | #280 | Tragic 12.1% |
| Malaysians | 0.2 /100 | #281 | Tragic 12.0% |
| Immigrants | El Salvador | 0.2 /100 | #282 | Tragic 12.0% |
| Hondurans | 0.2 /100 | #283 | Tragic 11.9% |
| Ottawa | 0.2 /100 | #284 | Tragic 11.9% |
| Immigrants | Nicaragua | 0.2 /100 | #285 | Tragic 11.8% |
| Aleuts | 0.1 /100 | #286 | Tragic 11.8% |
| Immigrants | Haiti | 0.1 /100 | #287 | Tragic 11.8% |
| Immigrants | Honduras | 0.1 /100 | #288 | Tragic 11.8% |
| Guatemalans | 0.1 /100 | #289 | Tragic 11.7% |
| Ute | 0.1 /100 | #290 | Tragic 11.7% |
| Colville | 0.1 /100 | #291 | Tragic 11.6% |
| Immigrants | Guatemala | 0.1 /100 | #292 | Tragic 11.6% |
| Alaska Natives | 0.1 /100 | #293 | Tragic 11.6% |