Immigrants from Germany vs Yuman Master's Degree
COMPARE
Immigrants from Germany
Yuman
Master's Degree
Master's Degree Comparison
Immigrants from Germany
Yuman
15.8%
MASTER'S DEGREE
85.9/ 100
METRIC RATING
139th/ 347
METRIC RANK
9.2%
MASTER'S DEGREE
0.0/ 100
METRIC RATING
345th/ 347
METRIC RANK
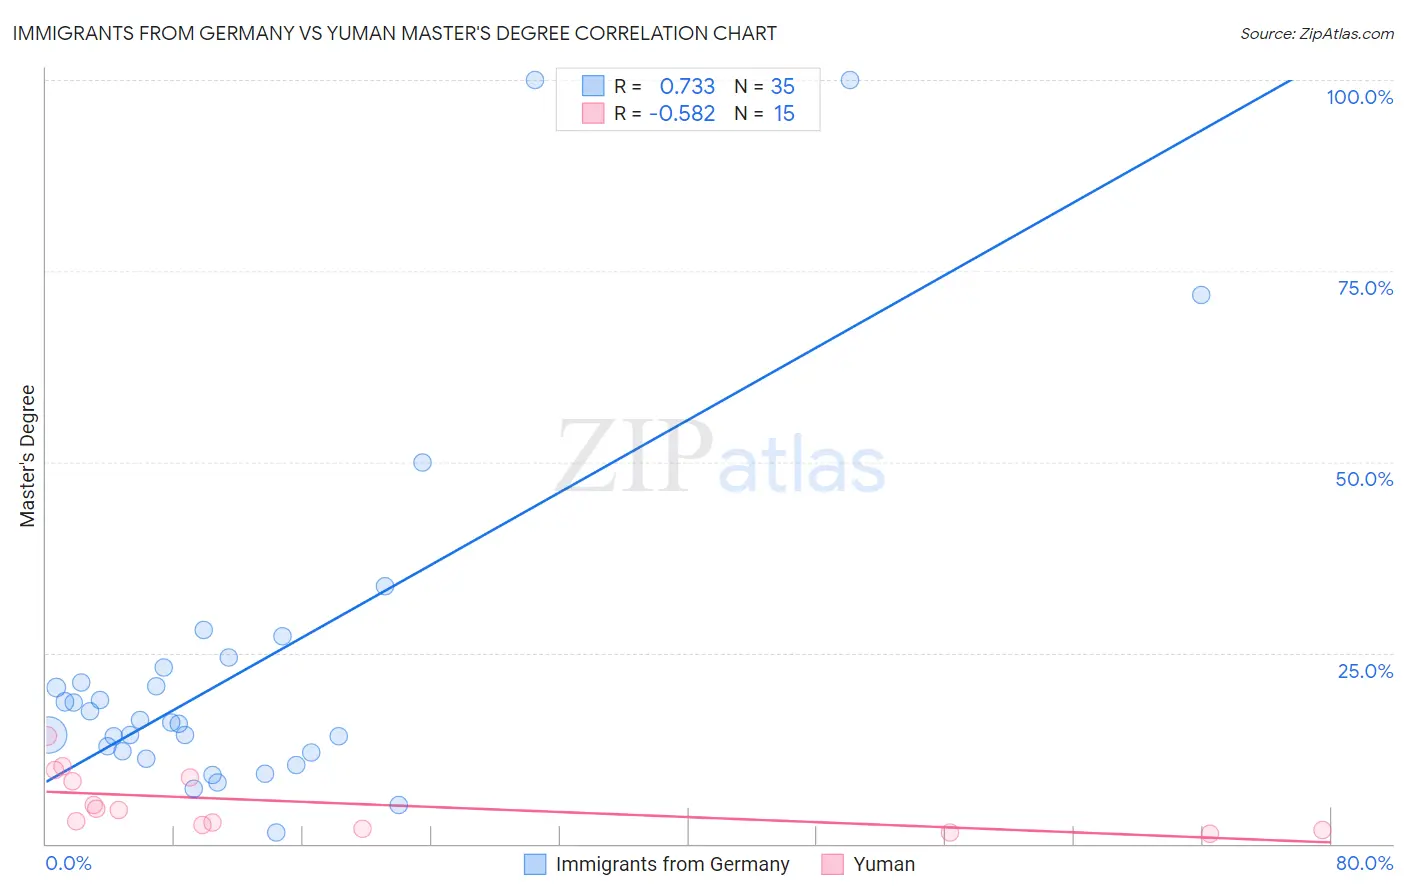
Immigrants from Germany vs Yuman Master's Degree Correlation Chart
The statistical analysis conducted on geographies consisting of 463,768,587 people shows a strong positive correlation between the proportion of Immigrants from Germany and percentage of population with at least master's degree education in the United States with a correlation coefficient (R) of 0.733 and weighted average of 15.8%. Similarly, the statistical analysis conducted on geographies consisting of 40,680,215 people shows a substantial negative correlation between the proportion of Yuman and percentage of population with at least master's degree education in the United States with a correlation coefficient (R) of -0.582 and weighted average of 9.2%, a difference of 70.9%.
Master's Degree Correlation Summary
| Measurement | Immigrants from Germany | Yuman |
| Minimum | 1.5% | 1.3% |
| Maximum | 100.0% | 14.1% |
| Range | 98.5% | 12.8% |
| Mean | 23.2% | 5.3% |
| Median | 15.9% | 4.4% |
| Interquartile 25% (IQ1) | 11.9% | 1.9% |
| Interquartile 75% (IQ3) | 23.0% | 8.6% |
| Interquartile Range (IQR) | 11.1% | 6.7% |
| Standard Deviation (Sample) | 23.1% | 3.9% |
| Standard Deviation (Population) | 22.7% | 3.8% |
Similar Demographics by Master's Degree
Demographics Similar to Immigrants from Germany by Master's Degree
In terms of master's degree, the demographic groups most similar to Immigrants from Germany are Pakistani (15.8%, a difference of 0.060%), Vietnamese (15.8%, a difference of 0.090%), European (15.8%, a difference of 0.14%), Polish (15.7%, a difference of 0.21%), and Assyrian/Chaldean/Syriac (15.8%, a difference of 0.24%).
| Demographics | Rating | Rank | Master's Degree |
| Serbians | 91.7 /100 | #132 | Exceptional 16.1% |
| Immigrants | Sudan | 90.2 /100 | #133 | Exceptional 16.0% |
| Venezuelans | 88.4 /100 | #134 | Excellent 15.9% |
| South American Indians | 88.4 /100 | #135 | Excellent 15.9% |
| Assyrians/Chaldeans/Syriacs | 86.8 /100 | #136 | Excellent 15.8% |
| Europeans | 86.4 /100 | #137 | Excellent 15.8% |
| Pakistanis | 86.1 /100 | #138 | Excellent 15.8% |
| Immigrants | Germany | 85.9 /100 | #139 | Excellent 15.8% |
| Vietnamese | 85.5 /100 | #140 | Excellent 15.8% |
| Poles | 85.0 /100 | #141 | Excellent 15.7% |
| Immigrants | Africa | 84.0 /100 | #142 | Excellent 15.7% |
| Immigrants | Venezuela | 83.6 /100 | #143 | Excellent 15.7% |
| Canadians | 83.3 /100 | #144 | Excellent 15.7% |
| South Americans | 81.3 /100 | #145 | Excellent 15.6% |
| Immigrants | Afghanistan | 79.4 /100 | #146 | Good 15.6% |
Demographics Similar to Yuman by Master's Degree
In terms of master's degree, the demographic groups most similar to Yuman are Pima (9.2%, a difference of 0.15%), Lumbee (9.3%, a difference of 0.32%), Immigrants from Mexico (9.3%, a difference of 0.81%), Navajo (9.4%, a difference of 2.1%), and Yakama (9.5%, a difference of 2.5%).
| Demographics | Rating | Rank | Master's Degree |
| Menominee | 0.0 /100 | #333 | Tragic 10.2% |
| Arapaho | 0.0 /100 | #334 | Tragic 10.0% |
| Immigrants | Central America | 0.0 /100 | #335 | Tragic 10.0% |
| Natives/Alaskans | 0.0 /100 | #336 | Tragic 9.9% |
| Mexicans | 0.0 /100 | #337 | Tragic 9.7% |
| Tohono O'odham | 0.0 /100 | #338 | Tragic 9.7% |
| Spanish American Indians | 0.0 /100 | #339 | Tragic 9.6% |
| Yakama | 0.0 /100 | #340 | Tragic 9.5% |
| Navajo | 0.0 /100 | #341 | Tragic 9.4% |
| Immigrants | Mexico | 0.0 /100 | #342 | Tragic 9.3% |
| Lumbee | 0.0 /100 | #343 | Tragic 9.3% |
| Pima | 0.0 /100 | #344 | Tragic 9.2% |
| Yuman | 0.0 /100 | #345 | Tragic 9.2% |
| Yup'ik | 0.0 /100 | #346 | Tragic 8.5% |
| Houma | 0.0 /100 | #347 | Tragic 7.9% |