Immigrants from Fiji vs Houma 11th Grade
COMPARE
Immigrants from Fiji
Houma
11th Grade
11th Grade Comparison
Immigrants from Fiji
Houma
89.9%
11TH GRADE
0.0/ 100
METRIC RATING
298th/ 347
METRIC RANK
87.0%
11TH GRADE
0.0/ 100
METRIC RATING
334th/ 347
METRIC RANK
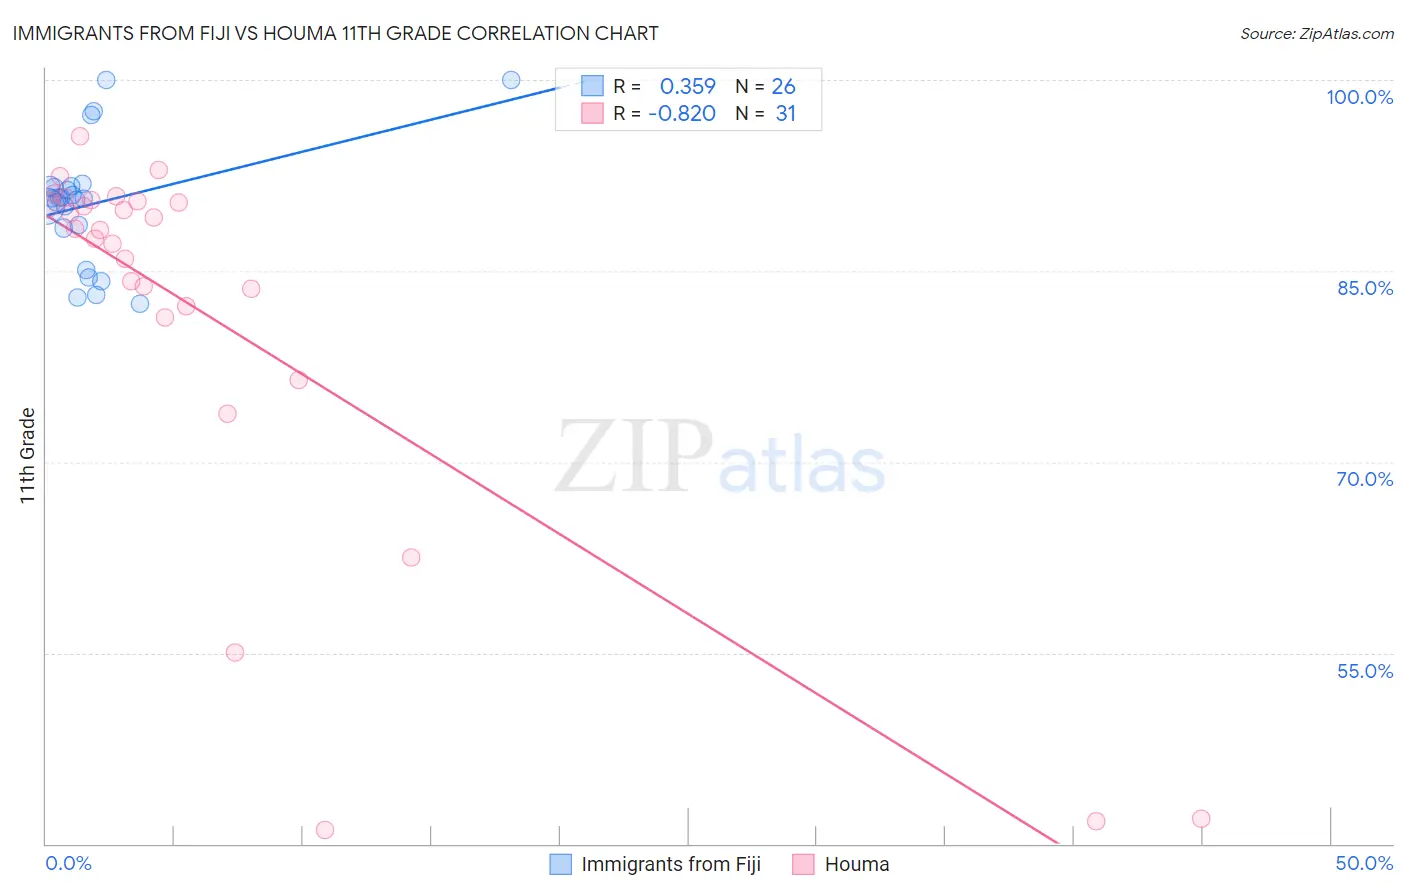
Immigrants from Fiji vs Houma 11th Grade Correlation Chart
The statistical analysis conducted on geographies consisting of 93,756,204 people shows a mild positive correlation between the proportion of Immigrants from Fiji and percentage of population with at least 11th grade education in the United States with a correlation coefficient (R) of 0.359 and weighted average of 89.9%. Similarly, the statistical analysis conducted on geographies consisting of 36,795,916 people shows a very strong negative correlation between the proportion of Houma and percentage of population with at least 11th grade education in the United States with a correlation coefficient (R) of -0.820 and weighted average of 87.0%, a difference of 3.3%.
11th Grade Correlation Summary
| Measurement | Immigrants from Fiji | Houma |
| Minimum | 82.4% | 41.1% |
| Maximum | 100.0% | 95.5% |
| Range | 17.6% | 54.5% |
| Mean | 90.3% | 81.2% |
| Median | 90.7% | 88.2% |
| Interquartile 25% (IQ1) | 88.4% | 81.4% |
| Interquartile 75% (IQ3) | 91.7% | 90.4% |
| Interquartile Range (IQR) | 3.3% | 9.1% |
| Standard Deviation (Sample) | 4.8% | 15.7% |
| Standard Deviation (Population) | 4.7% | 15.5% |
Similar Demographics by 11th Grade
Demographics Similar to Immigrants from Fiji by 11th Grade
In terms of 11th grade, the demographic groups most similar to Immigrants from Fiji are Japanese (89.9%, a difference of 0.030%), Immigrants from Haiti (89.9%, a difference of 0.040%), Guyanese (89.9%, a difference of 0.050%), Navajo (90.0%, a difference of 0.070%), and Fijian (90.0%, a difference of 0.11%).
| Demographics | Rating | Rank | 11th Grade |
| Haitians | 0.0 /100 | #291 | Tragic 90.3% |
| Cubans | 0.0 /100 | #292 | Tragic 90.2% |
| Natives/Alaskans | 0.0 /100 | #293 | Tragic 90.2% |
| Immigrants | Grenada | 0.0 /100 | #294 | Tragic 90.1% |
| Immigrants | Vietnam | 0.0 /100 | #295 | Tragic 90.0% |
| Fijians | 0.0 /100 | #296 | Tragic 90.0% |
| Navajo | 0.0 /100 | #297 | Tragic 90.0% |
| Immigrants | Fiji | 0.0 /100 | #298 | Tragic 89.9% |
| Japanese | 0.0 /100 | #299 | Tragic 89.9% |
| Immigrants | Haiti | 0.0 /100 | #300 | Tragic 89.9% |
| Guyanese | 0.0 /100 | #301 | Tragic 89.9% |
| Immigrants | Guyana | 0.0 /100 | #302 | Tragic 89.7% |
| Immigrants | Immigrants | 0.0 /100 | #303 | Tragic 89.7% |
| Yuman | 0.0 /100 | #304 | Tragic 89.7% |
| Immigrants | Cambodia | 0.0 /100 | #305 | Tragic 89.6% |
Demographics Similar to Houma by 11th Grade
In terms of 11th grade, the demographic groups most similar to Houma are Immigrants from Yemen (87.1%, a difference of 0.060%), Central American (86.9%, a difference of 0.10%), Immigrants from Dominican Republic (86.9%, a difference of 0.14%), Immigrants from Honduras (86.9%, a difference of 0.14%), and Immigrants from the Azores (87.2%, a difference of 0.24%).
| Demographics | Rating | Rank | 11th Grade |
| Immigrants | Cabo Verde | 0.0 /100 | #327 | Tragic 87.6% |
| Tohono O'odham | 0.0 /100 | #328 | Tragic 87.6% |
| Mexican American Indians | 0.0 /100 | #329 | Tragic 87.5% |
| Hondurans | 0.0 /100 | #330 | Tragic 87.4% |
| Hispanics or Latinos | 0.0 /100 | #331 | Tragic 87.3% |
| Immigrants | Azores | 0.0 /100 | #332 | Tragic 87.2% |
| Immigrants | Yemen | 0.0 /100 | #333 | Tragic 87.1% |
| Houma | 0.0 /100 | #334 | Tragic 87.0% |
| Central Americans | 0.0 /100 | #335 | Tragic 86.9% |
| Immigrants | Dominican Republic | 0.0 /100 | #336 | Tragic 86.9% |
| Immigrants | Honduras | 0.0 /100 | #337 | Tragic 86.9% |
| Immigrants | Latin America | 0.0 /100 | #338 | Tragic 86.8% |
| Guatemalans | 0.0 /100 | #339 | Tragic 86.4% |
| Salvadorans | 0.0 /100 | #340 | Tragic 86.2% |
| Mexicans | 0.0 /100 | #341 | Tragic 86.1% |