Immigrants from Fiji vs Sri Lankan 5th Grade
COMPARE
Immigrants from Fiji
Sri Lankan
5th Grade
5th Grade Comparison
Immigrants from Fiji
Sri Lankans
95.6%
5TH GRADE
0.0/ 100
METRIC RATING
323rd/ 347
METRIC RANK
96.1%
5TH GRADE
0.0/ 100
METRIC RATING
300th/ 347
METRIC RANK
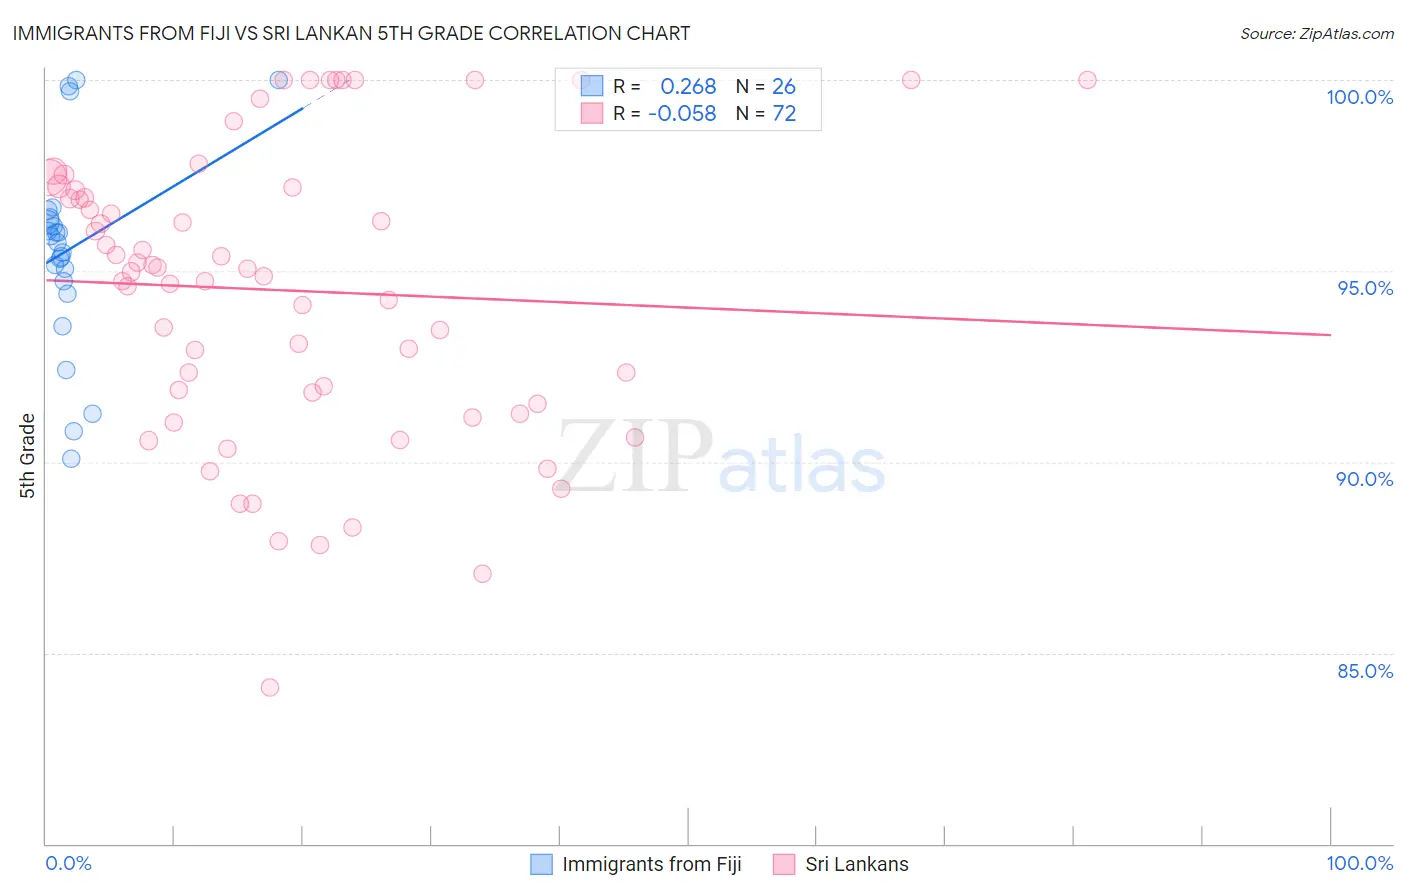
Immigrants from Fiji vs Sri Lankan 5th Grade Correlation Chart
The statistical analysis conducted on geographies consisting of 93,756,204 people shows a weak positive correlation between the proportion of Immigrants from Fiji and percentage of population with at least 5th grade education in the United States with a correlation coefficient (R) of 0.268 and weighted average of 95.6%. Similarly, the statistical analysis conducted on geographies consisting of 440,593,746 people shows a slight negative correlation between the proportion of Sri Lankans and percentage of population with at least 5th grade education in the United States with a correlation coefficient (R) of -0.058 and weighted average of 96.1%, a difference of 0.56%.
5th Grade Correlation Summary
| Measurement | Immigrants from Fiji | Sri Lankan |
| Minimum | 90.1% | 84.1% |
| Maximum | 100.0% | 100.0% |
| Range | 9.9% | 15.9% |
| Mean | 95.6% | 94.5% |
| Median | 95.8% | 95.0% |
| Interquartile 25% (IQ1) | 94.7% | 91.7% |
| Interquartile 75% (IQ3) | 96.4% | 97.1% |
| Interquartile Range (IQR) | 1.6% | 5.5% |
| Standard Deviation (Sample) | 2.6% | 3.8% |
| Standard Deviation (Population) | 2.5% | 3.8% |
Similar Demographics by 5th Grade
Demographics Similar to Immigrants from Fiji by 5th Grade
In terms of 5th grade, the demographic groups most similar to Immigrants from Fiji are Honduran (95.6%, a difference of 0.020%), Hispanic or Latino (95.6%, a difference of 0.020%), Immigrants from Nicaragua (95.6%, a difference of 0.050%), Immigrants from Cambodia (95.5%, a difference of 0.050%), and Dominican (95.5%, a difference of 0.050%).
| Demographics | Rating | Rank | 5th Grade |
| Immigrants | Ecuador | 0.0 /100 | #316 | Tragic 95.8% |
| Belizeans | 0.0 /100 | #317 | Tragic 95.8% |
| Immigrants | Vietnam | 0.0 /100 | #318 | Tragic 95.8% |
| Japanese | 0.0 /100 | #319 | Tragic 95.7% |
| Central American Indians | 0.0 /100 | #320 | Tragic 95.7% |
| Immigrants | Belize | 0.0 /100 | #321 | Tragic 95.7% |
| Immigrants | Nicaragua | 0.0 /100 | #322 | Tragic 95.6% |
| Immigrants | Fiji | 0.0 /100 | #323 | Tragic 95.6% |
| Hondurans | 0.0 /100 | #324 | Tragic 95.6% |
| Hispanics or Latinos | 0.0 /100 | #325 | Tragic 95.6% |
| Immigrants | Cambodia | 0.0 /100 | #326 | Tragic 95.5% |
| Dominicans | 0.0 /100 | #327 | Tragic 95.5% |
| Cape Verdeans | 0.0 /100 | #328 | Tragic 95.5% |
| Mexican American Indians | 0.0 /100 | #329 | Tragic 95.5% |
| Immigrants | Armenia | 0.0 /100 | #330 | Tragic 95.4% |
Demographics Similar to Sri Lankans by 5th Grade
In terms of 5th grade, the demographic groups most similar to Sri Lankans are Immigrants from Cuba (96.1%, a difference of 0.020%), Guyanese (96.1%, a difference of 0.030%), Puerto Rican (96.1%, a difference of 0.040%), Immigrants (96.2%, a difference of 0.050%), and Immigrants from Burma/Myanmar (96.1%, a difference of 0.070%).
| Demographics | Rating | Rank | 5th Grade |
| Immigrants | Grenada | 0.0 /100 | #293 | Tragic 96.5% |
| Immigrants | Eritrea | 0.0 /100 | #294 | Tragic 96.4% |
| Immigrants | Somalia | 0.0 /100 | #295 | Tragic 96.4% |
| Immigrants | South Eastern Asia | 0.0 /100 | #296 | Tragic 96.3% |
| Haitians | 0.0 /100 | #297 | Tragic 96.3% |
| Immigrants | Dominica | 0.0 /100 | #298 | Tragic 96.2% |
| Immigrants | Immigrants | 0.0 /100 | #299 | Tragic 96.2% |
| Sri Lankans | 0.0 /100 | #300 | Tragic 96.1% |
| Immigrants | Cuba | 0.0 /100 | #301 | Tragic 96.1% |
| Guyanese | 0.0 /100 | #302 | Tragic 96.1% |
| Puerto Ricans | 0.0 /100 | #303 | Tragic 96.1% |
| Immigrants | Burma/Myanmar | 0.0 /100 | #304 | Tragic 96.1% |
| Immigrants | Laos | 0.0 /100 | #305 | Tragic 96.0% |
| Immigrants | Haiti | 0.0 /100 | #306 | Tragic 96.0% |
| Immigrants | Caribbean | 0.0 /100 | #307 | Tragic 96.0% |