Immigrants from Ethiopia vs French Canadian 6th Grade
COMPARE
Immigrants from Ethiopia
French Canadian
6th Grade
6th Grade Comparison
Immigrants from Ethiopia
French Canadians
96.5%
6TH GRADE
0.6/ 100
METRIC RATING
254th/ 347
METRIC RANK
98.0%
6TH GRADE
100.0/ 100
METRIC RATING
30th/ 347
METRIC RANK
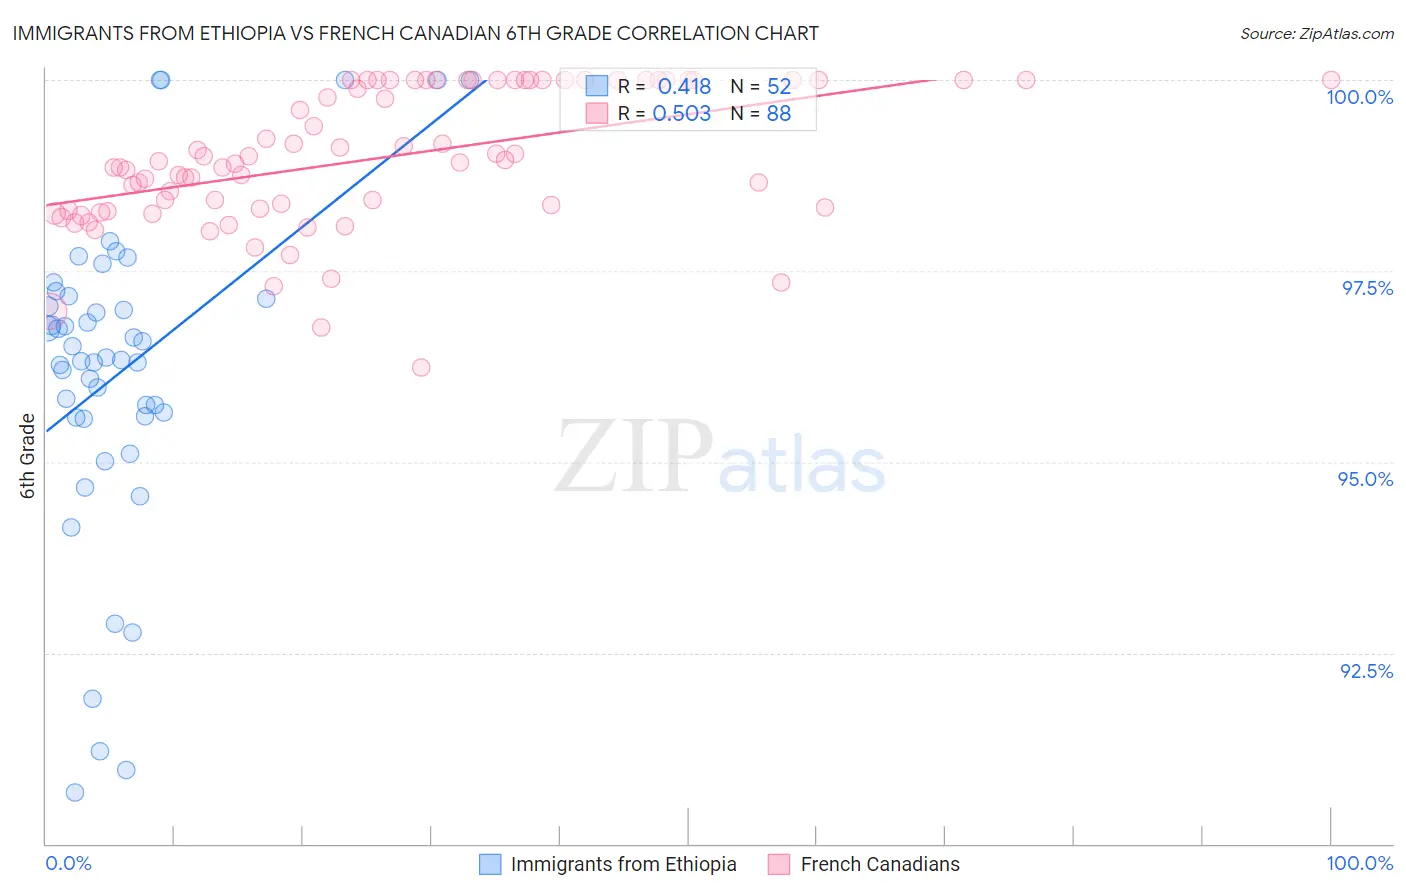
Immigrants from Ethiopia vs French Canadian 6th Grade Correlation Chart
The statistical analysis conducted on geographies consisting of 211,514,076 people shows a moderate positive correlation between the proportion of Immigrants from Ethiopia and percentage of population with at least 6th grade education in the United States with a correlation coefficient (R) of 0.418 and weighted average of 96.5%. Similarly, the statistical analysis conducted on geographies consisting of 502,679,457 people shows a substantial positive correlation between the proportion of French Canadians and percentage of population with at least 6th grade education in the United States with a correlation coefficient (R) of 0.503 and weighted average of 98.0%, a difference of 1.6%.
6th Grade Correlation Summary
| Measurement | Immigrants from Ethiopia | French Canadian |
| Minimum | 90.7% | 96.2% |
| Maximum | 100.0% | 100.0% |
| Range | 9.3% | 3.8% |
| Mean | 96.2% | 99.0% |
| Median | 96.4% | 98.9% |
| Interquartile 25% (IQ1) | 95.6% | 98.3% |
| Interquartile 75% (IQ3) | 97.2% | 100.0% |
| Interquartile Range (IQR) | 1.6% | 1.7% |
| Standard Deviation (Sample) | 2.1% | 0.90% |
| Standard Deviation (Population) | 2.1% | 0.90% |
Similar Demographics by 6th Grade
Demographics Similar to Immigrants from Ethiopia by 6th Grade
In terms of 6th grade, the demographic groups most similar to Immigrants from Ethiopia are Jamaican (96.5%, a difference of 0.0%), Immigrants from Congo (96.5%, a difference of 0.0%), Immigrants from Uruguay (96.5%, a difference of 0.010%), U.S. Virgin Islander (96.5%, a difference of 0.010%), and Immigrants from Senegal (96.5%, a difference of 0.020%).
| Demographics | Rating | Rank | 6th Grade |
| Bolivians | 1.0 /100 | #247 | Tragic 96.5% |
| Tohono O'odham | 1.0 /100 | #248 | Tragic 96.5% |
| Colombians | 0.9 /100 | #249 | Tragic 96.5% |
| Immigrants | Middle Africa | 0.8 /100 | #250 | Tragic 96.5% |
| Immigrants | Senegal | 0.7 /100 | #251 | Tragic 96.5% |
| Immigrants | Uruguay | 0.6 /100 | #252 | Tragic 96.5% |
| Jamaicans | 0.6 /100 | #253 | Tragic 96.5% |
| Immigrants | Ethiopia | 0.6 /100 | #254 | Tragic 96.5% |
| Immigrants | Congo | 0.6 /100 | #255 | Tragic 96.5% |
| U.S. Virgin Islanders | 0.5 /100 | #256 | Tragic 96.5% |
| Taiwanese | 0.5 /100 | #257 | Tragic 96.5% |
| Immigrants | China | 0.4 /100 | #258 | Tragic 96.4% |
| South Americans | 0.4 /100 | #259 | Tragic 96.4% |
| Peruvians | 0.4 /100 | #260 | Tragic 96.4% |
| Immigrants | Sierra Leone | 0.4 /100 | #261 | Tragic 96.4% |
Demographics Similar to French Canadians by 6th Grade
In terms of 6th grade, the demographic groups most similar to French Canadians are European (98.0%, a difference of 0.0%), Yup'ik (98.0%, a difference of 0.010%), Scandinavian (98.0%, a difference of 0.010%), French (98.0%, a difference of 0.010%), and Alaska Native (98.0%, a difference of 0.010%).
| Demographics | Rating | Rank | 6th Grade |
| Sioux | 100.0 /100 | #23 | Exceptional 98.0% |
| Croatians | 100.0 /100 | #24 | Exceptional 98.0% |
| Scotch-Irish | 100.0 /100 | #25 | Exceptional 98.0% |
| Czechs | 100.0 /100 | #26 | Exceptional 98.0% |
| Yup'ik | 100.0 /100 | #27 | Exceptional 98.0% |
| Scandinavians | 100.0 /100 | #28 | Exceptional 98.0% |
| French | 100.0 /100 | #29 | Exceptional 98.0% |
| French Canadians | 100.0 /100 | #30 | Exceptional 98.0% |
| Europeans | 100.0 /100 | #31 | Exceptional 98.0% |
| Alaska Natives | 100.0 /100 | #32 | Exceptional 98.0% |
| Chippewa | 100.0 /100 | #33 | Exceptional 97.9% |
| Swiss | 100.0 /100 | #34 | Exceptional 97.9% |
| Chinese | 100.0 /100 | #35 | Exceptional 97.9% |
| Italians | 100.0 /100 | #36 | Exceptional 97.9% |
| British | 100.0 /100 | #37 | Exceptional 97.9% |