Immigrants from Ethiopia vs Immigrants from Barbados College, 1 year or more
COMPARE
Immigrants from Ethiopia
Immigrants from Barbados
College, 1 year or more
College, 1 year or more Comparison
Immigrants from Ethiopia
Immigrants from Barbados
62.6%
COLLEGE, 1 YEAR OR MORE
98.2/ 100
METRIC RATING
89th/ 347
METRIC RANK
55.4%
COLLEGE, 1 YEAR OR MORE
0.6/ 100
METRIC RATING
253rd/ 347
METRIC RANK
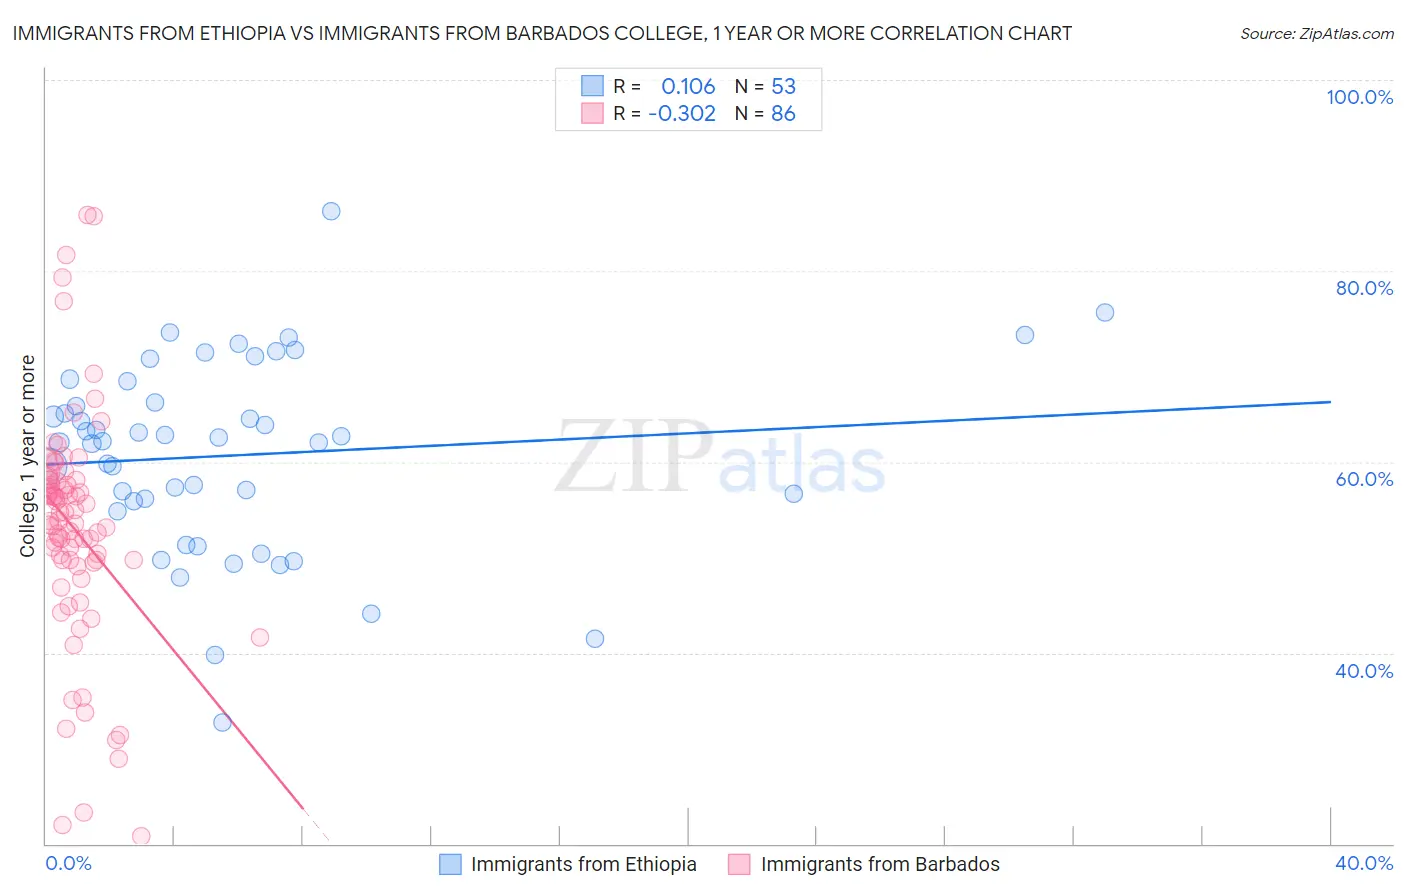
Immigrants from Ethiopia vs Immigrants from Barbados College, 1 year or more Correlation Chart
The statistical analysis conducted on geographies consisting of 211,551,397 people shows a poor positive correlation between the proportion of Immigrants from Ethiopia and percentage of population with at least college, 1 year or more education in the United States with a correlation coefficient (R) of 0.106 and weighted average of 62.6%. Similarly, the statistical analysis conducted on geographies consisting of 112,783,541 people shows a mild negative correlation between the proportion of Immigrants from Barbados and percentage of population with at least college, 1 year or more education in the United States with a correlation coefficient (R) of -0.302 and weighted average of 55.4%, a difference of 13.0%.
College, 1 year or more Correlation Summary
| Measurement | Immigrants from Ethiopia | Immigrants from Barbados |
| Minimum | 32.7% | 20.7% |
| Maximum | 86.2% | 85.8% |
| Range | 53.5% | 65.1% |
| Mean | 60.7% | 53.0% |
| Median | 62.2% | 53.8% |
| Interquartile 25% (IQ1) | 55.3% | 49.7% |
| Interquartile 75% (IQ3) | 67.3% | 58.1% |
| Interquartile Range (IQR) | 12.0% | 8.4% |
| Standard Deviation (Sample) | 10.1% | 12.1% |
| Standard Deviation (Population) | 10.0% | 12.1% |
Similar Demographics by College, 1 year or more
Demographics Similar to Immigrants from Ethiopia by College, 1 year or more
In terms of college, 1 year or more, the demographic groups most similar to Immigrants from Ethiopia are Greek (62.6%, a difference of 0.10%), Immigrants from Western Asia (62.5%, a difference of 0.17%), Immigrants from Hungary (62.7%, a difference of 0.27%), Immigrants from Eastern Europe (62.4%, a difference of 0.28%), and Immigrants from Western Europe (62.7%, a difference of 0.29%).
| Demographics | Rating | Rank | College, 1 year or more |
| Immigrants | Bolivia | 98.7 /100 | #82 | Exceptional 62.8% |
| Immigrants | Argentina | 98.6 /100 | #83 | Exceptional 62.8% |
| Immigrants | England | 98.6 /100 | #84 | Exceptional 62.8% |
| Immigrants | Pakistan | 98.6 /100 | #85 | Exceptional 62.8% |
| Immigrants | Western Europe | 98.6 /100 | #86 | Exceptional 62.7% |
| Immigrants | Hungary | 98.6 /100 | #87 | Exceptional 62.7% |
| Greeks | 98.3 /100 | #88 | Exceptional 62.6% |
| Immigrants | Ethiopia | 98.2 /100 | #89 | Exceptional 62.6% |
| Immigrants | Western Asia | 97.9 /100 | #90 | Exceptional 62.5% |
| Immigrants | Eastern Europe | 97.8 /100 | #91 | Exceptional 62.4% |
| Immigrants | Egypt | 97.8 /100 | #92 | Exceptional 62.4% |
| Romanians | 97.7 /100 | #93 | Exceptional 62.4% |
| Immigrants | Croatia | 97.6 /100 | #94 | Exceptional 62.3% |
| British | 97.4 /100 | #95 | Exceptional 62.3% |
| Chinese | 97.2 /100 | #96 | Exceptional 62.2% |
Demographics Similar to Immigrants from Barbados by College, 1 year or more
In terms of college, 1 year or more, the demographic groups most similar to Immigrants from Barbados are Aleut (55.4%, a difference of 0.11%), Immigrants from Cambodia (55.4%, a difference of 0.13%), Delaware (55.5%, a difference of 0.23%), Immigrants from Trinidad and Tobago (55.5%, a difference of 0.25%), and Japanese (55.2%, a difference of 0.25%).
| Demographics | Rating | Rank | College, 1 year or more |
| Malaysians | 0.8 /100 | #246 | Tragic 55.6% |
| Hawaiians | 0.8 /100 | #247 | Tragic 55.6% |
| Immigrants | Congo | 0.8 /100 | #248 | Tragic 55.6% |
| Immigrants | Trinidad and Tobago | 0.7 /100 | #249 | Tragic 55.5% |
| Delaware | 0.7 /100 | #250 | Tragic 55.5% |
| Immigrants | Cambodia | 0.6 /100 | #251 | Tragic 55.4% |
| Aleuts | 0.6 /100 | #252 | Tragic 55.4% |
| Immigrants | Barbados | 0.6 /100 | #253 | Tragic 55.4% |
| Japanese | 0.5 /100 | #254 | Tragic 55.2% |
| Immigrants | Bahamas | 0.5 /100 | #255 | Tragic 55.2% |
| Immigrants | West Indies | 0.5 /100 | #256 | Tragic 55.2% |
| Indonesians | 0.4 /100 | #257 | Tragic 55.1% |
| Africans | 0.4 /100 | #258 | Tragic 55.0% |
| Nepalese | 0.3 /100 | #259 | Tragic 54.9% |
| Jamaicans | 0.3 /100 | #260 | Tragic 54.9% |