Immigrants from Eritrea vs Turkish 4th Grade
COMPARE
Immigrants from Eritrea
Turkish
4th Grade
4th Grade Comparison
Immigrants from Eritrea
Turks
96.7%
4TH GRADE
0.0/ 100
METRIC RATING
294th/ 347
METRIC RANK
97.9%
4TH GRADE
98.2/ 100
METRIC RATING
99th/ 347
METRIC RANK
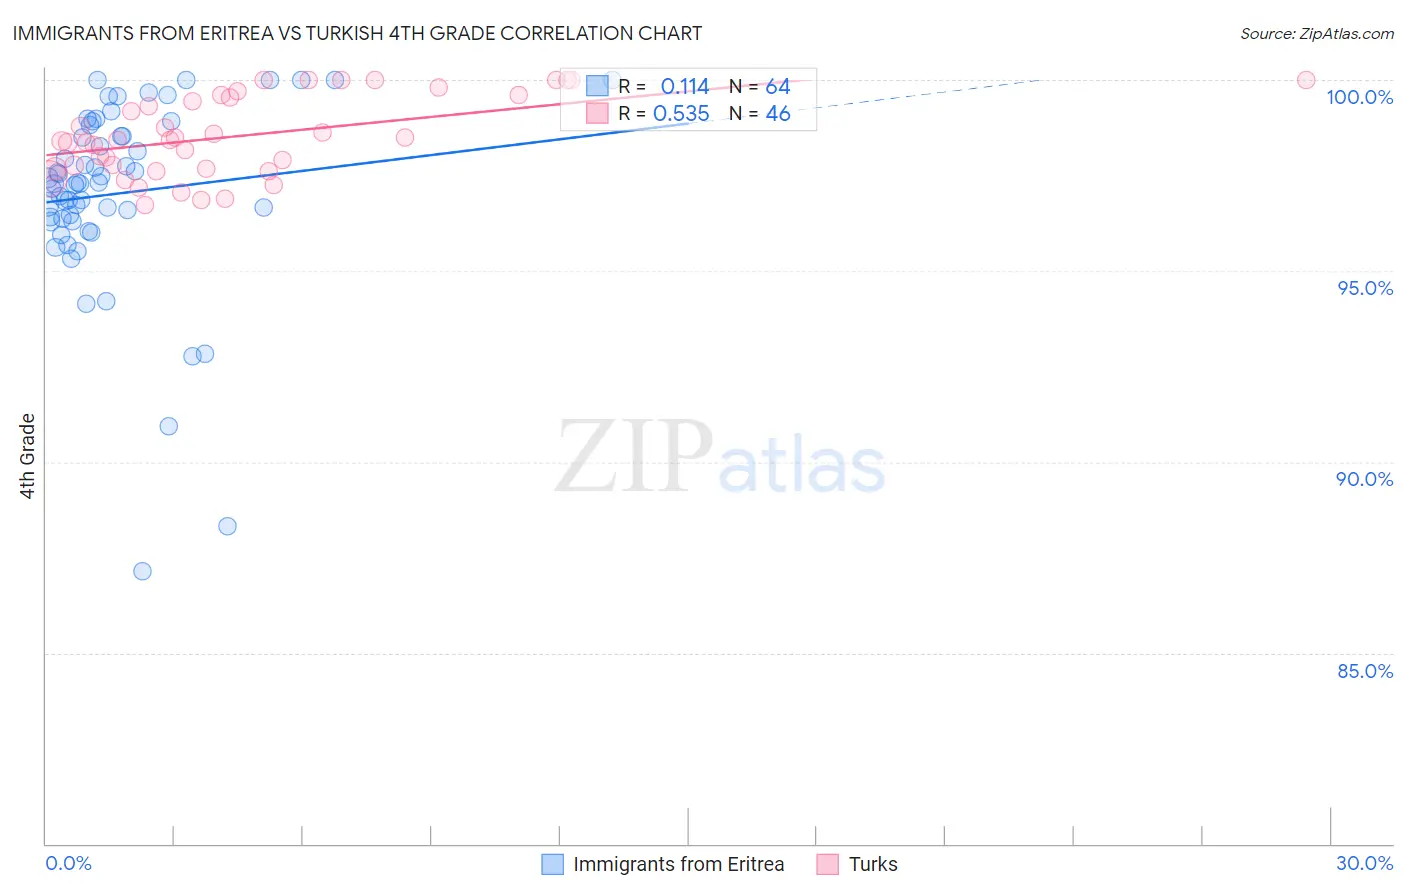
Immigrants from Eritrea vs Turkish 4th Grade Correlation Chart
The statistical analysis conducted on geographies consisting of 104,791,429 people shows a poor positive correlation between the proportion of Immigrants from Eritrea and percentage of population with at least 4th grade education in the United States with a correlation coefficient (R) of 0.114 and weighted average of 96.7%. Similarly, the statistical analysis conducted on geographies consisting of 271,858,657 people shows a substantial positive correlation between the proportion of Turks and percentage of population with at least 4th grade education in the United States with a correlation coefficient (R) of 0.535 and weighted average of 97.9%, a difference of 1.3%.
4th Grade Correlation Summary
| Measurement | Immigrants from Eritrea | Turkish |
| Minimum | 87.1% | 96.7% |
| Maximum | 100.0% | 100.0% |
| Range | 12.9% | 3.3% |
| Mean | 97.0% | 98.5% |
| Median | 97.3% | 98.4% |
| Interquartile 25% (IQ1) | 96.3% | 97.7% |
| Interquartile 75% (IQ3) | 98.7% | 99.6% |
| Interquartile Range (IQR) | 2.3% | 1.9% |
| Standard Deviation (Sample) | 2.5% | 1.0% |
| Standard Deviation (Population) | 2.5% | 1.0% |
Similar Demographics by 4th Grade
Demographics Similar to Immigrants from Eritrea by 4th Grade
In terms of 4th grade, the demographic groups most similar to Immigrants from Eritrea are Puerto Rican (96.7%, a difference of 0.020%), Immigrants from Portugal (96.6%, a difference of 0.020%), Somali (96.6%, a difference of 0.030%), Malaysian (96.7%, a difference of 0.040%), and Immigrants from Grenada (96.7%, a difference of 0.050%).
| Demographics | Rating | Rank | 4th Grade |
| Houma | 0.0 /100 | #287 | Tragic 96.8% |
| Immigrants | Afghanistan | 0.0 /100 | #288 | Tragic 96.8% |
| Immigrants | West Indies | 0.0 /100 | #289 | Tragic 96.7% |
| British West Indians | 0.0 /100 | #290 | Tragic 96.7% |
| Immigrants | Grenada | 0.0 /100 | #291 | Tragic 96.7% |
| Malaysians | 0.0 /100 | #292 | Tragic 96.7% |
| Puerto Ricans | 0.0 /100 | #293 | Tragic 96.7% |
| Immigrants | Eritrea | 0.0 /100 | #294 | Tragic 96.7% |
| Immigrants | Portugal | 0.0 /100 | #295 | Tragic 96.6% |
| Somalis | 0.0 /100 | #296 | Tragic 96.6% |
| Immigrants | Somalia | 0.0 /100 | #297 | Tragic 96.5% |
| Haitians | 0.0 /100 | #298 | Tragic 96.5% |
| Immigrants | Dominica | 0.0 /100 | #299 | Tragic 96.5% |
| Immigrants | South Eastern Asia | 0.0 /100 | #300 | Tragic 96.5% |
| Immigrants | Immigrants | 0.0 /100 | #301 | Tragic 96.5% |
Demographics Similar to Turks by 4th Grade
In terms of 4th grade, the demographic groups most similar to Turks are South African (97.9%, a difference of 0.0%), Yugoslavian (97.9%, a difference of 0.0%), Romanian (97.9%, a difference of 0.010%), Cheyenne (97.9%, a difference of 0.010%), and Cree (97.9%, a difference of 0.010%).
| Demographics | Rating | Rank | 4th Grade |
| Immigrants | Western Europe | 98.7 /100 | #92 | Exceptional 97.9% |
| Immigrants | Ireland | 98.7 /100 | #93 | Exceptional 97.9% |
| Shoshone | 98.7 /100 | #94 | Exceptional 97.9% |
| Immigrants | Germany | 98.5 /100 | #95 | Exceptional 97.9% |
| Romanians | 98.4 /100 | #96 | Exceptional 97.9% |
| Cheyenne | 98.4 /100 | #97 | Exceptional 97.9% |
| South Africans | 98.2 /100 | #98 | Exceptional 97.9% |
| Turks | 98.2 /100 | #99 | Exceptional 97.9% |
| Yugoslavians | 98.1 /100 | #100 | Exceptional 97.9% |
| Cree | 98.1 /100 | #101 | Exceptional 97.9% |
| Choctaw | 97.9 /100 | #102 | Exceptional 97.9% |
| Puget Sound Salish | 97.7 /100 | #103 | Exceptional 97.9% |
| Immigrants | Nonimmigrants | 97.5 /100 | #104 | Exceptional 97.9% |
| German Russians | 97.5 /100 | #105 | Exceptional 97.9% |
| Immigrants | Czechoslovakia | 97.5 /100 | #106 | Exceptional 97.9% |