Immigrants from Eritrea vs Hmong 5th Grade

COMPARE

Immigrants from Eritrea
Race
Ancestry
AfghanAfricanAlaska NativeAlaskan AthabascanAlbanianAleutAlsatianAmericanApacheArabArapahoArgentineanArmenianAssyrian/Chaldean/SyriacAustralianAustrianBahamianBangladeshiBarbadianBasqueBelgianBelizeanBermudanBhutaneseBlackfeetBolivianBrazilianBritishBritish West IndianBulgarianBurmeseCajunCambodianCanadianCape VerdeanCarpatho RusynCelticCentral AmericanCentral American IndianCherokeeCheyenneChickasawChileanChineseChippewaChoctawColombianColvilleComancheCosta RicanCreeCreekCroatianCrowCubanCypriotCzechCzechoslovakianDanishDelawareDominicanDutchDutch West IndianEastern EuropeanEcuadorianEgyptianEnglishEstonianEthiopianEuropeanFijianFilipinoFinnishFrenchFrench American IndianFrench CanadianGermanGerman RussianGhanaianGreekGuamanian/ChamorroGuatemalanGuyaneseHaitianHonduranHopiHoumaHungarianIcelanderIndian (Asian)IndonesianInupiatIranianIraqiIrishIroquoisIsraeliItalianJamaicanJapaneseJordanianKenyanKiowaKoreanLaotianLatvianLebaneseLiberianLithuanianLumbeeLuxembourgerMacedonianMalaysianMalteseMarshalleseMenomineeMexicanMexican American IndianMongolianMoroccanNative HawaiianNavajoNepaleseNew ZealanderNicaraguanNigerianNorthern EuropeanNorwegianOkinawanOsageOttawaPaiutePakistaniPalestinianPanamanianParaguayanPennsylvania GermanPeruvianPimaPolishPortuguesePotawatomiPuebloPuerto RicanPuget Sound SalishRomanianRussianSalvadoranSamoanScandinavianScotch-IrishScottishSeminoleSenegaleseSerbianShoshoneSierra LeoneanSiouxSlavicSlovakSloveneSomaliSouth AfricanSouth AmericanSouth American IndianSoviet UnionSpaniardSpanishSpanish AmericanSpanish American IndianSri LankanSubsaharan AfricanSudaneseSwedishSwissSyrianTaiwaneseThaiTlingit-HaidaTohono O'OdhamTonganTrinidadian and TobagonianTsimshianTurkishU.S. Virgin IslanderUgandanUkrainianUruguayanUteVenezuelanVietnameseWelshWest IndianYakamaYaquiYugoslavianYumanYup'ikZimbabwean
Immigration
NonimmigrantsImmigrantsAfghanistanAfricaAlbaniaArgentinaArmeniaAsiaAustraliaAustriaBahamasBangladeshBarbadosBelarusBelgiumBelizeBoliviaBosnia and HerzegovinaBrazilBulgariaBurma/MyanmarCabo VerdeCambodiaCameroonCanadaCaribbeanCentral AmericaChileChinaColombiaCongoCosta RicaCroatiaCubaCzechoslovakiaDenmarkDominicaDominican RepublicEastern AfricaEastern AsiaEastern EuropeEcuadorEgyptEl SalvadorEnglandEritreaEthiopiaEuropeFijiFranceGermanyGhanaGreeceGrenadaGuatemalaGuyanaHaitiHondurasHong KongHungaryIndiaIndonesiaIranIraqIrelandIsraelItalyJamaicaJapanJordanKazakhstanKenyaKoreaKuwaitLaosLatin AmericaLatviaLebanonLiberiaLithuaniaMalaysiaMexicoMicronesiaMiddle AfricaMoldovaMoroccoNepalNetherlandsNicaraguaNigeriaNorth AmericaNorth MacedoniaNorthern AfricaNorthern EuropeNorwayOceaniaPakistanPanamaPeruPhilippinesPolandPortugalRomaniaRussiaSaudi ArabiaScotlandSenegalSerbiaSierra LeoneSingaporeSomaliaSouth AfricaSouth AmericaSouth Central AsiaSouth Eastern AsiaSouthern EuropeSpainSri LankaSt. Vincent and the GrenadinesSudanSwedenSwitzerlandSyriaTaiwanThailandTrinidad and TobagoTurkeyUgandaUkraineUruguayUzbekistanVenezuelaVietnamWest IndiesWestern AfricaWestern AsiaWestern EuropeYemenZaireZimbabweAzores
Hmong
Race
Ancestry
AfghanAfricanAlaska NativeAlaskan AthabascanAlbanianAleutAlsatianAmericanApacheArabArapahoArgentineanArmenianAssyrian/Chaldean/SyriacAustralianAustrianBahamianBangladeshiBarbadianBasqueBelgianBelizeanBermudanBhutaneseBlackfeetBolivianBrazilianBritishBritish West IndianBulgarianBurmeseCajunCambodianCanadianCape VerdeanCarpatho RusynCelticCentral AmericanCentral American IndianCherokeeCheyenneChickasawChileanChineseChippewaChoctawColombianColvilleComancheCosta RicanCreeCreekCroatianCrowCubanCypriotCzechCzechoslovakianDanishDelawareDominicanDutchDutch West IndianEastern EuropeanEcuadorianEgyptianEnglishEstonianEthiopianEuropeanFijianFilipinoFinnishFrenchFrench American IndianFrench CanadianGermanGerman RussianGhanaianGreekGuamanian/ChamorroGuatemalanGuyaneseHaitianHmongHonduranHopiHoumaHungarianIcelanderIndian (Asian)IndonesianInupiatIranianIraqiIrishIroquoisIsraeliItalianJamaicanJapaneseJordanianKenyanKiowaKoreanLaotianLatvianLebaneseLiberianLithuanianLumbeeLuxembourgerMacedonianMalaysianMalteseMarshalleseMenomineeMexicanMexican American IndianMongolianMoroccanNative HawaiianNavajoNepaleseNew ZealanderNicaraguanNigerianNorthern EuropeanNorwegianOkinawanOsageOttawaPaiutePakistaniPalestinianPanamanianParaguayanPennsylvania GermanPeruvianPimaPolishPortuguesePotawatomiPuebloPuerto RicanPuget Sound SalishRomanianRussianSalvadoranSamoanScandinavianScotch-IrishScottishSeminoleSenegaleseSerbianShoshoneSierra LeoneanSiouxSlavicSlovakSloveneSomaliSouth AfricanSouth AmericanSouth American IndianSoviet UnionSpaniardSpanishSpanish AmericanSpanish American IndianSri LankanSubsaharan AfricanSudaneseSwedishSwissSyrianTaiwaneseThaiTlingit-HaidaTohono O'OdhamTonganTrinidadian and TobagonianTsimshianTurkishU.S. Virgin IslanderUgandanUkrainianUruguayanUteVenezuelanVietnameseWelshWest IndianYakamaYaquiYugoslavianYumanYup'ikZimbabwean
Immigration
NonimmigrantsImmigrantsAfghanistanAfricaAlbaniaArgentinaArmeniaAsiaAustraliaAustriaBahamasBangladeshBarbadosBelarusBelgiumBelizeBoliviaBosnia and HerzegovinaBrazilBulgariaBurma/MyanmarCabo VerdeCambodiaCameroonCanadaCaribbeanCentral AmericaChileChinaColombiaCongoCosta RicaCroatiaCubaCzechoslovakiaDenmarkDominicaDominican RepublicEastern AfricaEastern AsiaEastern EuropeEcuadorEgyptEl SalvadorEnglandEthiopiaEuropeFijiFranceGermanyGhanaGreeceGrenadaGuatemalaGuyanaHaitiHondurasHong KongHungaryIndiaIndonesiaIranIraqIrelandIsraelItalyJamaicaJapanJordanKazakhstanKenyaKoreaKuwaitLaosLatin AmericaLatviaLebanonLiberiaLithuaniaMalaysiaMexicoMicronesiaMiddle AfricaMoldovaMoroccoNepalNetherlandsNicaraguaNigeriaNorth AmericaNorth MacedoniaNorthern AfricaNorthern EuropeNorwayOceaniaPakistanPanamaPeruPhilippinesPolandPortugalRomaniaRussiaSaudi ArabiaScotlandSenegalSerbiaSierra LeoneSingaporeSomaliaSouth AfricaSouth AmericaSouth Central AsiaSouth Eastern AsiaSouthern EuropeSpainSri LankaSt. Vincent and the GrenadinesSudanSwedenSwitzerlandSyriaTaiwanThailandTrinidad and TobagoTurkeyUgandaUkraineUruguayUzbekistanVenezuelaVietnamWest IndiesWestern AfricaWestern AsiaWestern EuropeYemenZaireZimbabweAzores
5th Grade
Income
Poverty
Unemployment
Labor Participation
Family Structure
Vehicle Availability
Education Level
Disability

5th Grade Comparison

Immigrants from Eritrea

Hmong

Tragic
Exceptional
96.4%
5TH GRADE
0.0/ 100
METRIC RATING
294th/ 347
METRIC RANK
97.6%
5TH GRADE
92.3/ 100
METRIC RATING
126th/ 347
METRIC RANK

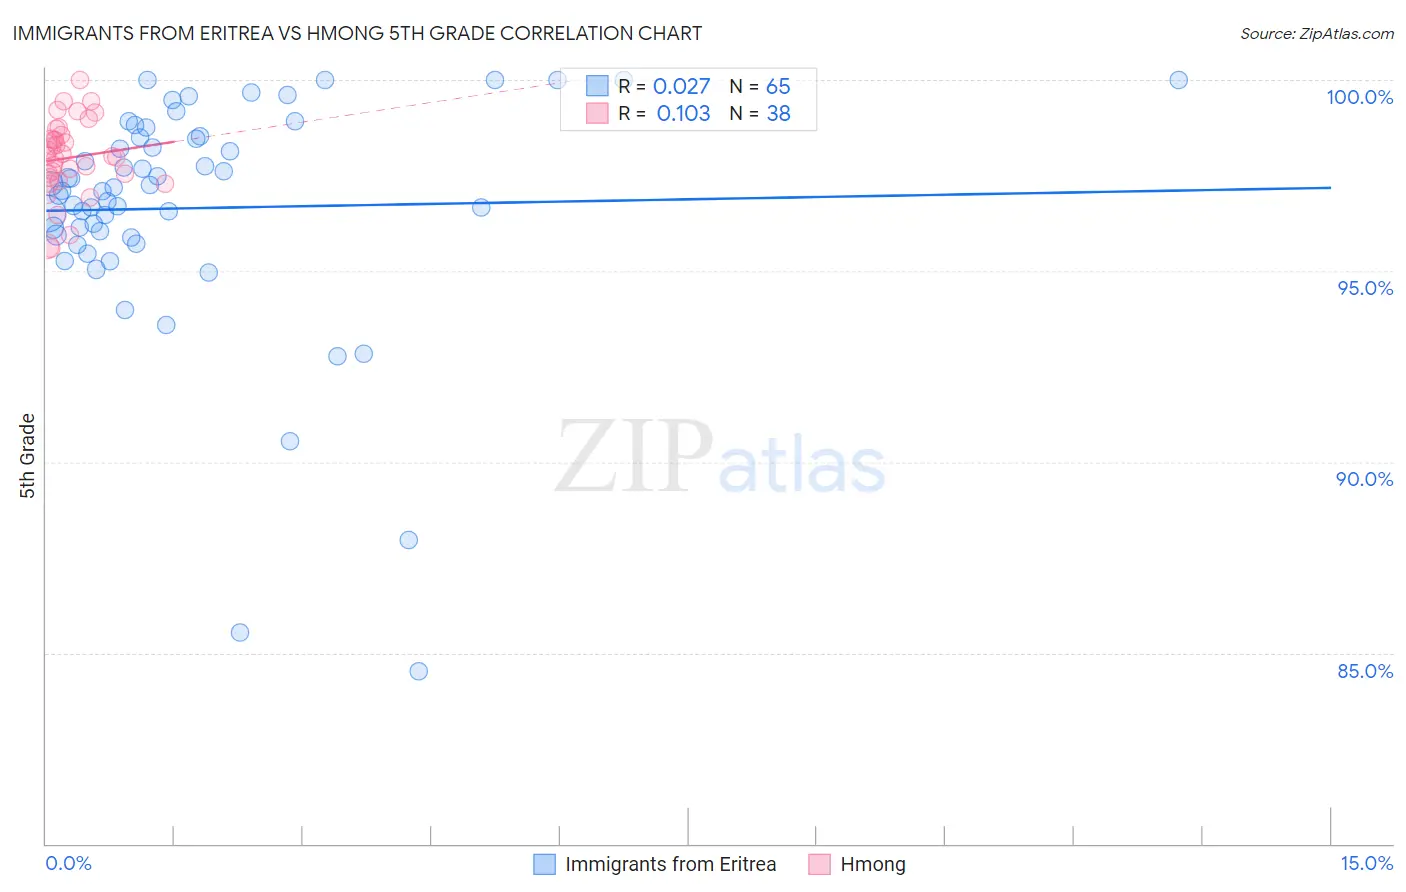
Immigrants from Eritrea vs Hmong 5th Grade Correlation Chart

The statistical analysis conducted on geographies consisting of 104,792,854 people shows no correlation between the proportion of Immigrants from Eritrea and percentage of population with at least 5th grade education in the United States with a correlation coefficient (R) of 0.027 and weighted average of 96.4%. Similarly, the statistical analysis conducted on geographies consisting of 24,672,093 people shows a poor positive correlation between the proportion of Hmong and percentage of population with at least 5th grade education in the United States with a correlation coefficient (R) of 0.103 and weighted average of 97.6%, a difference of 1.2%.
Immigrants from Eritrea vs Hmong 5th Grade

5th Grade Correlation Summary

MeasurementImmigrants from EritreaHmong
Minimum84.5%95.6%
Maximum100.0%100.0%
Range15.5%4.4%
Mean96.6%98.0%
Median97.1%98.0%
Interquartile 25% (IQ1)95.9%97.5%
Interquartile 75% (IQ3)98.5%98.6%
Interquartile Range (IQR)2.6%1.1%
Standard Deviation (Sample)3.1%1.0%
Standard Deviation (Population)3.0%1.0%

Similar Demographics by 5th Grade

Demographics Similar to Immigrants from Eritrea by 5th Grade

In terms of 5th grade, the demographic groups most similar to Immigrants from Eritrea are Immigrants from Grenada (96.5%, a difference of 0.040%), Immigrants from Somalia (96.4%, a difference of 0.040%), Somali (96.5%, a difference of 0.050%), British West Indian (96.5%, a difference of 0.060%), and Malaysian (96.5%, a difference of 0.060%).
DemographicsRating | Rank5th Grade
Immigrants | Afghanistan
0.1
/100
|
#287
Tragic
96.6%
Immigrants | Barbados
0.0
/100
|
#288
Tragic
96.6%
Immigrants | West Indies
0.0
/100
|
#289
Tragic
96.5%
British West Indians
0.0
/100
|
#290
Tragic
96.5%
Malaysians
0.0
/100
|
#291
Tragic
96.5%
Somalis
0.0
/100
|
#292
Tragic
96.5%
Immigrants | Grenada
0.0
/100
|
#293
Tragic
96.5%
Immigrants | Eritrea
0.0
/100
|
#294
Tragic
96.4%
Immigrants | Somalia
0.0
/100
|
#295
Tragic
96.4%
Immigrants | South Eastern Asia
0.0
/100
|
#296
Tragic
96.3%
Haitians
0.0
/100
|
#297
Tragic
96.3%
Immigrants | Dominica
0.0
/100
|
#298
Tragic
96.2%
Immigrants | Immigrants
0.0
/100
|
#299
Tragic
96.2%
Sri Lankans
0.0
/100
|
#300
Tragic
96.1%
Immigrants | Cuba
0.0
/100
|
#301
Tragic
96.1%

Demographics Similar to Hmong by 5th Grade

In terms of 5th grade, the demographic groups most similar to Hmong are Immigrants from Serbia (97.6%, a difference of 0.0%), Colville (97.6%, a difference of 0.0%), Immigrants from Bulgaria (97.6%, a difference of 0.010%), Immigrants from Europe (97.6%, a difference of 0.010%), and Immigrants from Romania (97.6%, a difference of 0.010%).
DemographicsRating | Rank5th Grade
Syrians
95.1
/100
|
#119
Exceptional
97.6%
Immigrants | Zimbabwe
94.9
/100
|
#120
Exceptional
97.6%
Immigrants | France
94.8
/100
|
#121
Exceptional
97.6%
Immigrants | Japan
94.7
/100
|
#122
Exceptional
97.6%
Immigrants | Norway
94.6
/100
|
#123
Exceptional
97.6%
Spanish
93.7
/100
|
#124
Exceptional
97.6%
Immigrants | Bulgaria
93.1
/100
|
#125
Exceptional
97.6%
Hmong
92.3
/100
|
#126
Exceptional
97.6%
Immigrants | Serbia
92.3
/100
|
#127
Exceptional
97.6%
Colville
92.0
/100
|
#128
Exceptional
97.6%
Immigrants | Europe
91.9
/100
|
#129
Exceptional
97.6%
Immigrants | Romania
91.6
/100
|
#130
Exceptional
97.6%
Pima
91.2
/100
|
#131
Exceptional
97.6%
Immigrants | Kuwait
90.4
/100
|
#132
Exceptional
97.6%
Cambodians
90.2
/100
|
#133
Exceptional
97.6%