Austrian vs Immigrants from Vietnam 5th Grade
COMPARE
Austrian
Immigrants from Vietnam
5th Grade
5th Grade Comparison
Austrians
Immigrants from Vietnam
97.9%
5TH GRADE
99.8/ 100
METRIC RATING
57th/ 347
METRIC RANK
95.8%
5TH GRADE
0.0/ 100
METRIC RATING
318th/ 347
METRIC RANK
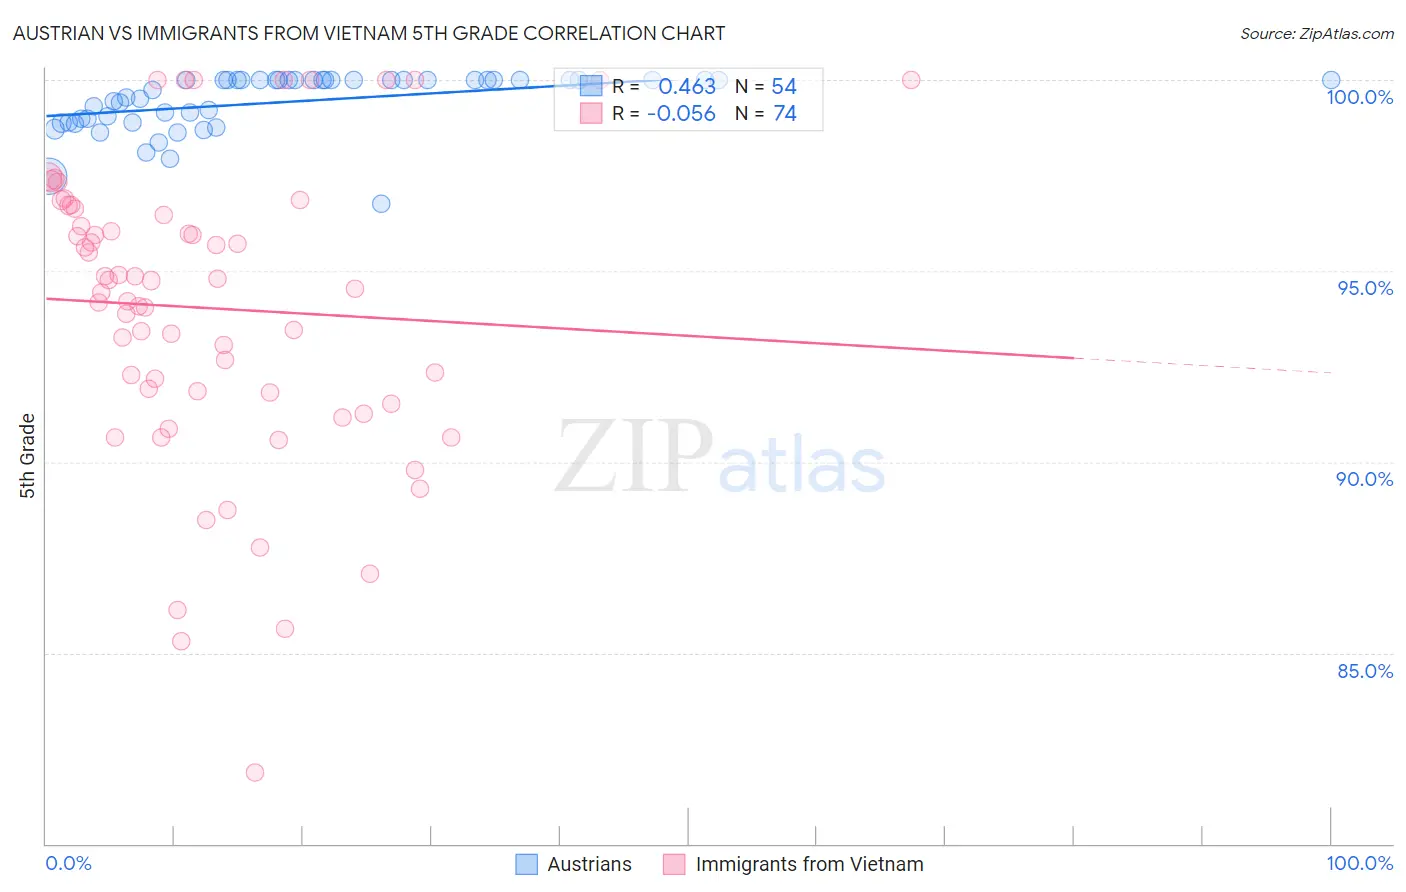
Austrian vs Immigrants from Vietnam 5th Grade Correlation Chart
The statistical analysis conducted on geographies consisting of 452,080,536 people shows a moderate positive correlation between the proportion of Austrians and percentage of population with at least 5th grade education in the United States with a correlation coefficient (R) of 0.463 and weighted average of 97.9%. Similarly, the statistical analysis conducted on geographies consisting of 404,844,130 people shows a slight negative correlation between the proportion of Immigrants from Vietnam and percentage of population with at least 5th grade education in the United States with a correlation coefficient (R) of -0.056 and weighted average of 95.8%, a difference of 2.3%.
5th Grade Correlation Summary
| Measurement | Austrian | Immigrants from Vietnam |
| Minimum | 96.8% | 81.9% |
| Maximum | 100.0% | 100.0% |
| Range | 3.2% | 18.1% |
| Mean | 99.4% | 94.0% |
| Median | 100.0% | 94.6% |
| Interquartile 25% (IQ1) | 98.9% | 91.8% |
| Interquartile 75% (IQ3) | 100.0% | 96.6% |
| Interquartile Range (IQR) | 1.1% | 4.8% |
| Standard Deviation (Sample) | 0.75% | 3.9% |
| Standard Deviation (Population) | 0.75% | 3.9% |
Similar Demographics by 5th Grade
Demographics Similar to Austrians by 5th Grade
In terms of 5th grade, the demographic groups most similar to Austrians are Creek (98.0%, a difference of 0.0%), Greek (97.9%, a difference of 0.0%), White/Caucasian (97.9%, a difference of 0.0%), Australian (98.0%, a difference of 0.010%), and American (97.9%, a difference of 0.010%).
| Demographics | Rating | Rank | 5th Grade |
| Immigrants | Scotland | 99.8 /100 | #50 | Exceptional 98.0% |
| Celtics | 99.8 /100 | #51 | Exceptional 98.0% |
| Maltese | 99.8 /100 | #52 | Exceptional 98.0% |
| Slavs | 99.8 /100 | #53 | Exceptional 98.0% |
| Australians | 99.8 /100 | #54 | Exceptional 98.0% |
| Creek | 99.8 /100 | #55 | Exceptional 98.0% |
| Greeks | 99.8 /100 | #56 | Exceptional 97.9% |
| Austrians | 99.8 /100 | #57 | Exceptional 97.9% |
| Whites/Caucasians | 99.8 /100 | #58 | Exceptional 97.9% |
| Americans | 99.7 /100 | #59 | Exceptional 97.9% |
| Immigrants | Canada | 99.7 /100 | #60 | Exceptional 97.9% |
| Serbians | 99.7 /100 | #61 | Exceptional 97.9% |
| Immigrants | North America | 99.7 /100 | #62 | Exceptional 97.9% |
| Russians | 99.7 /100 | #63 | Exceptional 97.9% |
| Immigrants | Northern Europe | 99.6 /100 | #64 | Exceptional 97.9% |
Demographics Similar to Immigrants from Vietnam by 5th Grade
In terms of 5th grade, the demographic groups most similar to Immigrants from Vietnam are Belizean (95.8%, a difference of 0.030%), Immigrants from Ecuador (95.8%, a difference of 0.050%), Japanese (95.7%, a difference of 0.050%), Central American Indian (95.7%, a difference of 0.050%), and Nicaraguan (95.9%, a difference of 0.12%).
| Demographics | Rating | Rank | 5th Grade |
| Immigrants | Bangladesh | 0.0 /100 | #311 | Tragic 96.0% |
| Vietnamese | 0.0 /100 | #312 | Tragic 95.9% |
| Bangladeshis | 0.0 /100 | #313 | Tragic 95.9% |
| Immigrants | Portugal | 0.0 /100 | #314 | Tragic 95.9% |
| Nicaraguans | 0.0 /100 | #315 | Tragic 95.9% |
| Immigrants | Ecuador | 0.0 /100 | #316 | Tragic 95.8% |
| Belizeans | 0.0 /100 | #317 | Tragic 95.8% |
| Immigrants | Vietnam | 0.0 /100 | #318 | Tragic 95.8% |
| Japanese | 0.0 /100 | #319 | Tragic 95.7% |
| Central American Indians | 0.0 /100 | #320 | Tragic 95.7% |
| Immigrants | Belize | 0.0 /100 | #321 | Tragic 95.7% |
| Immigrants | Nicaragua | 0.0 /100 | #322 | Tragic 95.6% |
| Immigrants | Fiji | 0.0 /100 | #323 | Tragic 95.6% |
| Hondurans | 0.0 /100 | #324 | Tragic 95.6% |
| Hispanics or Latinos | 0.0 /100 | #325 | Tragic 95.6% |