Immigrants from El Salvador vs Subsaharan African 5th Grade
COMPARE
Immigrants from El Salvador
Subsaharan African
5th Grade
5th Grade Comparison
Immigrants from El Salvador
Sub-Saharan Africans
94.3%
5TH GRADE
0.0/ 100
METRIC RATING
346th/ 347
METRIC RANK
97.0%
5TH GRADE
3.3/ 100
METRIC RATING
233rd/ 347
METRIC RANK
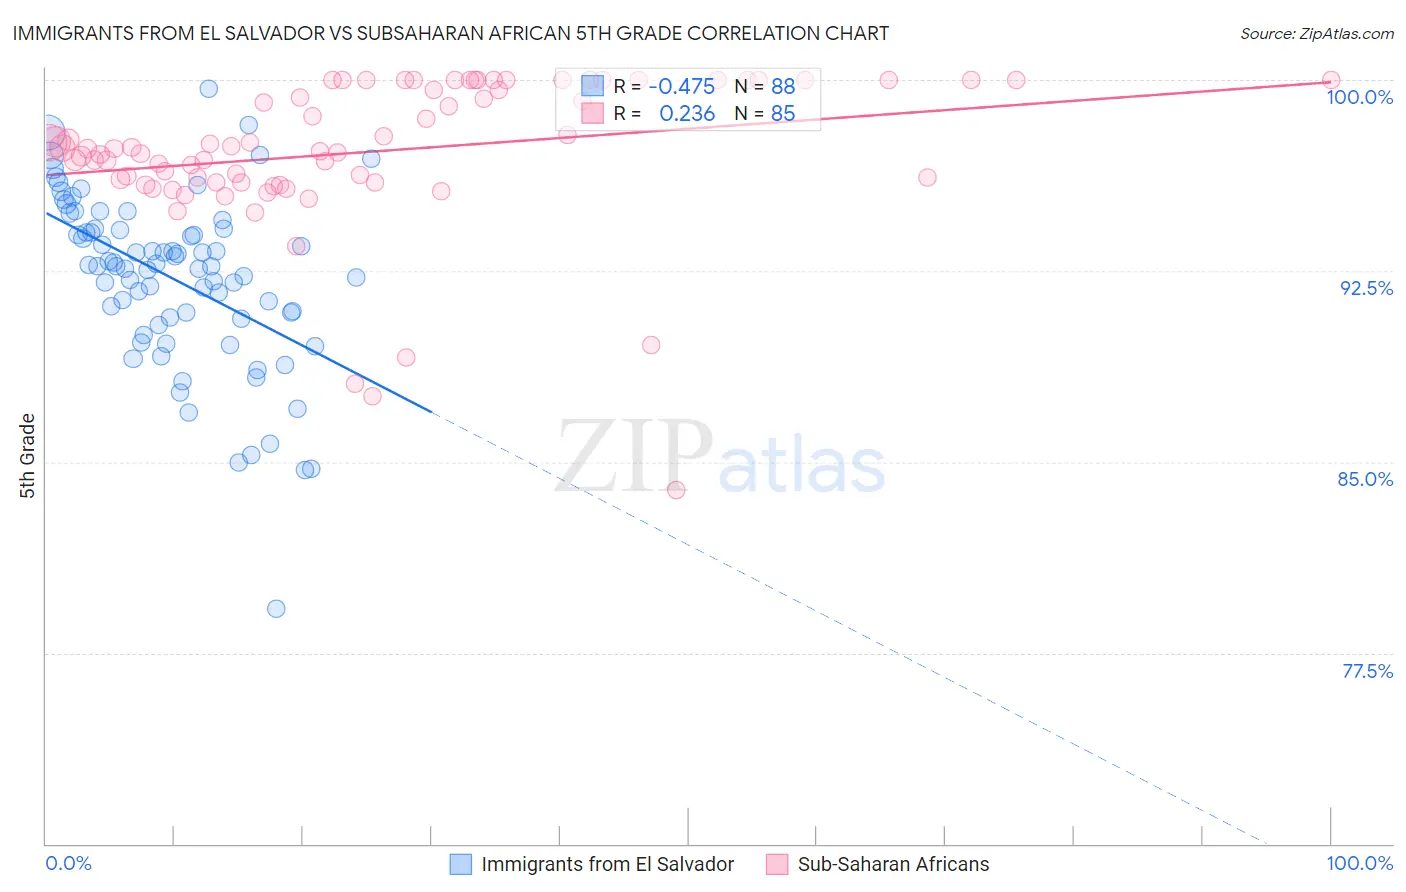
Immigrants from El Salvador vs Subsaharan African 5th Grade Correlation Chart
The statistical analysis conducted on geographies consisting of 357,823,835 people shows a moderate negative correlation between the proportion of Immigrants from El Salvador and percentage of population with at least 5th grade education in the United States with a correlation coefficient (R) of -0.475 and weighted average of 94.3%. Similarly, the statistical analysis conducted on geographies consisting of 508,219,094 people shows a weak positive correlation between the proportion of Sub-Saharan Africans and percentage of population with at least 5th grade education in the United States with a correlation coefficient (R) of 0.236 and weighted average of 97.0%, a difference of 2.8%.
5th Grade Correlation Summary
| Measurement | Immigrants from El Salvador | Subsaharan African |
| Minimum | 79.2% | 83.9% |
| Maximum | 99.7% | 100.0% |
| Range | 20.4% | 16.1% |
| Mean | 92.2% | 97.2% |
| Median | 92.7% | 97.3% |
| Interquartile 25% (IQ1) | 90.7% | 96.0% |
| Interquartile 75% (IQ3) | 94.1% | 100.0% |
| Interquartile Range (IQR) | 3.5% | 4.0% |
| Standard Deviation (Sample) | 3.4% | 3.0% |
| Standard Deviation (Population) | 3.4% | 3.0% |
Similar Demographics by 5th Grade
Demographics Similar to Immigrants from El Salvador by 5th Grade
In terms of 5th grade, the demographic groups most similar to Immigrants from El Salvador are Spanish American Indian (94.2%, a difference of 0.11%), Immigrants from Guatemala (94.6%, a difference of 0.28%), Salvadoran (94.6%, a difference of 0.29%), Immigrants from Mexico (94.6%, a difference of 0.29%), and Immigrants from Central America (94.7%, a difference of 0.34%).
| Demographics | Rating | Rank | 5th Grade |
| Immigrants | Latin America | 0.0 /100 | #333 | Tragic 95.3% |
| Nepalese | 0.0 /100 | #334 | Tragic 95.2% |
| Mexicans | 0.0 /100 | #335 | Tragic 95.2% |
| Immigrants | Azores | 0.0 /100 | #336 | Tragic 95.1% |
| Central Americans | 0.0 /100 | #337 | Tragic 95.1% |
| Immigrants | Cabo Verde | 0.0 /100 | #338 | Tragic 94.9% |
| Immigrants | Yemen | 0.0 /100 | #339 | Tragic 94.9% |
| Guatemalans | 0.0 /100 | #340 | Tragic 94.8% |
| Yakama | 0.0 /100 | #341 | Tragic 94.8% |
| Immigrants | Central America | 0.0 /100 | #342 | Tragic 94.7% |
| Salvadorans | 0.0 /100 | #343 | Tragic 94.6% |
| Immigrants | Mexico | 0.0 /100 | #344 | Tragic 94.6% |
| Immigrants | Guatemala | 0.0 /100 | #345 | Tragic 94.6% |
| Immigrants | El Salvador | 0.0 /100 | #346 | Tragic 94.3% |
| Spanish American Indians | 0.0 /100 | #347 | Tragic 94.2% |
Demographics Similar to Sub-Saharan Africans by 5th Grade
In terms of 5th grade, the demographic groups most similar to Sub-Saharan Africans are Tohono O'odham (97.0%, a difference of 0.0%), Uruguayan (97.0%, a difference of 0.0%), Immigrants from Malaysia (97.0%, a difference of 0.020%), Immigrants from Eastern Asia (97.0%, a difference of 0.020%), and Senegalese (97.0%, a difference of 0.020%).
| Demographics | Rating | Rank | 5th Grade |
| Tongans | 5.3 /100 | #226 | Tragic 97.0% |
| Immigrants | Pakistan | 4.7 /100 | #227 | Tragic 97.0% |
| Assyrians/Chaldeans/Syriacs | 4.5 /100 | #228 | Tragic 97.0% |
| Yuman | 4.5 /100 | #229 | Tragic 97.0% |
| Immigrants | Western Asia | 4.3 /100 | #230 | Tragic 97.0% |
| Immigrants | Malaysia | 4.1 /100 | #231 | Tragic 97.0% |
| Immigrants | Eastern Asia | 4.0 /100 | #232 | Tragic 97.0% |
| Sub-Saharan Africans | 3.3 /100 | #233 | Tragic 97.0% |
| Tohono O'odham | 3.2 /100 | #234 | Tragic 97.0% |
| Uruguayans | 3.2 /100 | #235 | Tragic 97.0% |
| Senegalese | 2.8 /100 | #236 | Tragic 97.0% |
| Immigrants | Indonesia | 2.0 /100 | #237 | Tragic 96.9% |
| Asians | 2.0 /100 | #238 | Tragic 96.9% |
| Nigerians | 1.9 /100 | #239 | Tragic 96.9% |
| Indians (Asian) | 1.9 /100 | #240 | Tragic 96.9% |