Immigrants from El Salvador vs Immigrants from Mexico 5th Grade
COMPARE
Immigrants from El Salvador
Immigrants from Mexico
5th Grade
5th Grade Comparison
Immigrants from El Salvador
Immigrants from Mexico
94.3%
5TH GRADE
0.0/ 100
METRIC RATING
346th/ 347
METRIC RANK
94.6%
5TH GRADE
0.0/ 100
METRIC RATING
344th/ 347
METRIC RANK
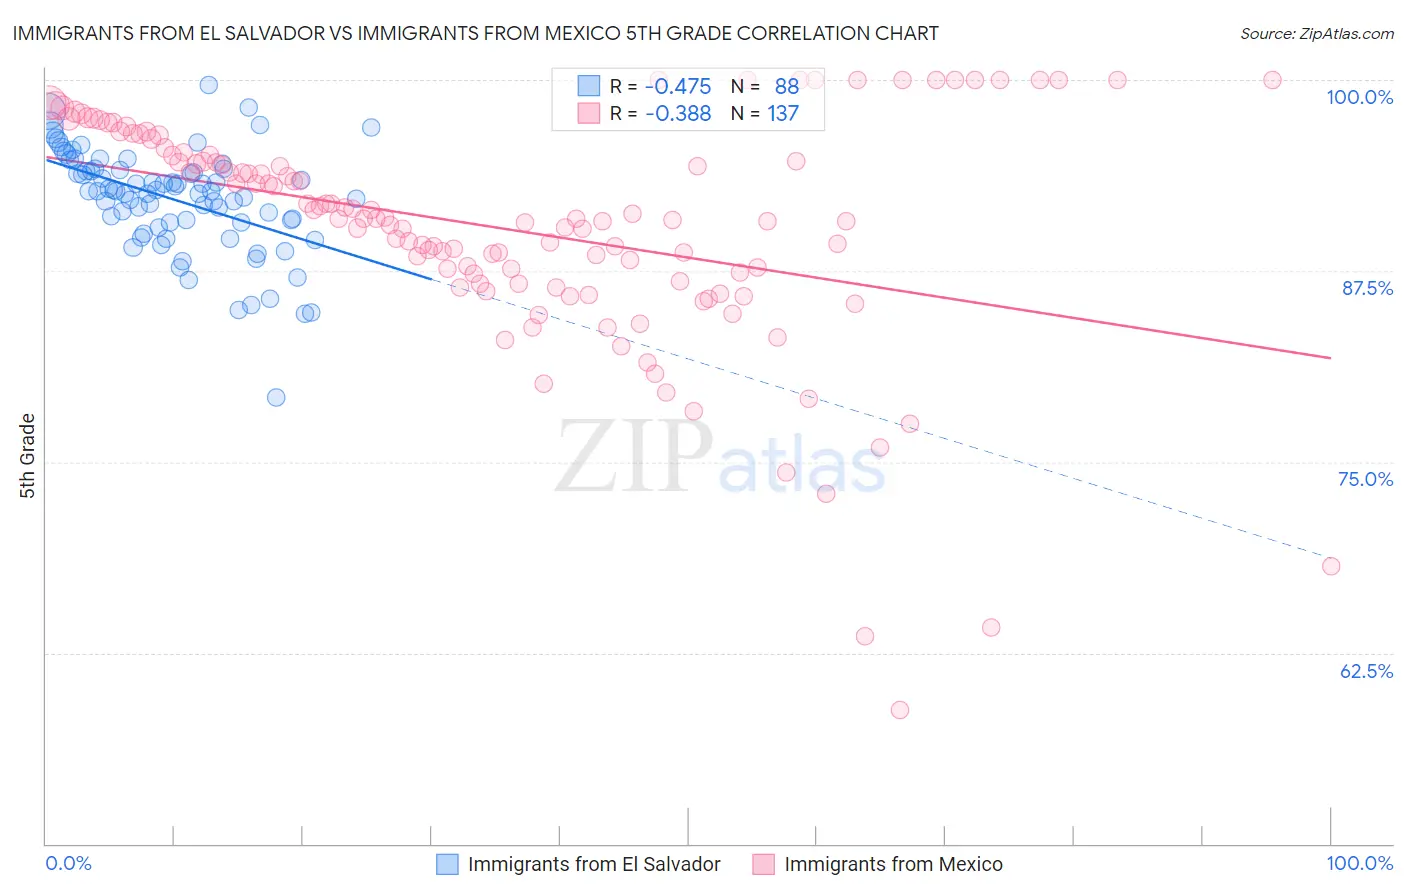
Immigrants from El Salvador vs Immigrants from Mexico 5th Grade Correlation Chart
The statistical analysis conducted on geographies consisting of 357,823,835 people shows a moderate negative correlation between the proportion of Immigrants from El Salvador and percentage of population with at least 5th grade education in the United States with a correlation coefficient (R) of -0.475 and weighted average of 94.3%. Similarly, the statistical analysis conducted on geographies consisting of 513,767,628 people shows a mild negative correlation between the proportion of Immigrants from Mexico and percentage of population with at least 5th grade education in the United States with a correlation coefficient (R) of -0.388 and weighted average of 94.6%, a difference of 0.29%.
5th Grade Correlation Summary
| Measurement | Immigrants from El Salvador | Immigrants from Mexico |
| Minimum | 79.2% | 58.8% |
| Maximum | 99.7% | 100.0% |
| Range | 20.4% | 41.2% |
| Mean | 92.2% | 90.3% |
| Median | 92.7% | 90.9% |
| Interquartile 25% (IQ1) | 90.7% | 86.8% |
| Interquartile 75% (IQ3) | 94.1% | 95.2% |
| Interquartile Range (IQR) | 3.5% | 8.4% |
| Standard Deviation (Sample) | 3.4% | 7.5% |
| Standard Deviation (Population) | 3.4% | 7.5% |
Demographics Similar to Immigrants from El Salvador and Immigrants from Mexico by 5th Grade
In terms of 5th grade, the demographic groups most similar to Immigrants from El Salvador are Spanish American Indian (94.2%, a difference of 0.11%), Immigrants from Guatemala (94.6%, a difference of 0.28%), Salvadoran (94.6%, a difference of 0.29%), Immigrants from Central America (94.7%, a difference of 0.34%), and Yakama (94.8%, a difference of 0.45%). Similarly, the demographic groups most similar to Immigrants from Mexico are Salvadoran (94.6%, a difference of 0.0%), Immigrants from Guatemala (94.6%, a difference of 0.010%), Immigrants from Central America (94.7%, a difference of 0.060%), Yakama (94.8%, a difference of 0.16%), and Guatemalan (94.8%, a difference of 0.24%).
| Demographics | Rating | Rank | 5th Grade |
| Cape Verdeans | 0.0 /100 | #328 | Tragic 95.5% |
| Mexican American Indians | 0.0 /100 | #329 | Tragic 95.5% |
| Immigrants | Armenia | 0.0 /100 | #330 | Tragic 95.4% |
| Immigrants | Honduras | 0.0 /100 | #331 | Tragic 95.4% |
| Immigrants | Dominican Republic | 0.0 /100 | #332 | Tragic 95.3% |
| Immigrants | Latin America | 0.0 /100 | #333 | Tragic 95.3% |
| Nepalese | 0.0 /100 | #334 | Tragic 95.2% |
| Mexicans | 0.0 /100 | #335 | Tragic 95.2% |
| Immigrants | Azores | 0.0 /100 | #336 | Tragic 95.1% |
| Central Americans | 0.0 /100 | #337 | Tragic 95.1% |
| Immigrants | Cabo Verde | 0.0 /100 | #338 | Tragic 94.9% |
| Immigrants | Yemen | 0.0 /100 | #339 | Tragic 94.9% |
| Guatemalans | 0.0 /100 | #340 | Tragic 94.8% |
| Yakama | 0.0 /100 | #341 | Tragic 94.8% |
| Immigrants | Central America | 0.0 /100 | #342 | Tragic 94.7% |
| Salvadorans | 0.0 /100 | #343 | Tragic 94.6% |
| Immigrants | Mexico | 0.0 /100 | #344 | Tragic 94.6% |
| Immigrants | Guatemala | 0.0 /100 | #345 | Tragic 94.6% |
| Immigrants | El Salvador | 0.0 /100 | #346 | Tragic 94.3% |
| Spanish American Indians | 0.0 /100 | #347 | Tragic 94.2% |