Immigrants from El Salvador vs South American 5th Grade
COMPARE
Immigrants from El Salvador
South American
5th Grade
5th Grade Comparison
Immigrants from El Salvador
South Americans
94.3%
5TH GRADE
0.0/ 100
METRIC RATING
346th/ 347
METRIC RANK
96.8%
5TH GRADE
0.7/ 100
METRIC RATING
255th/ 347
METRIC RANK
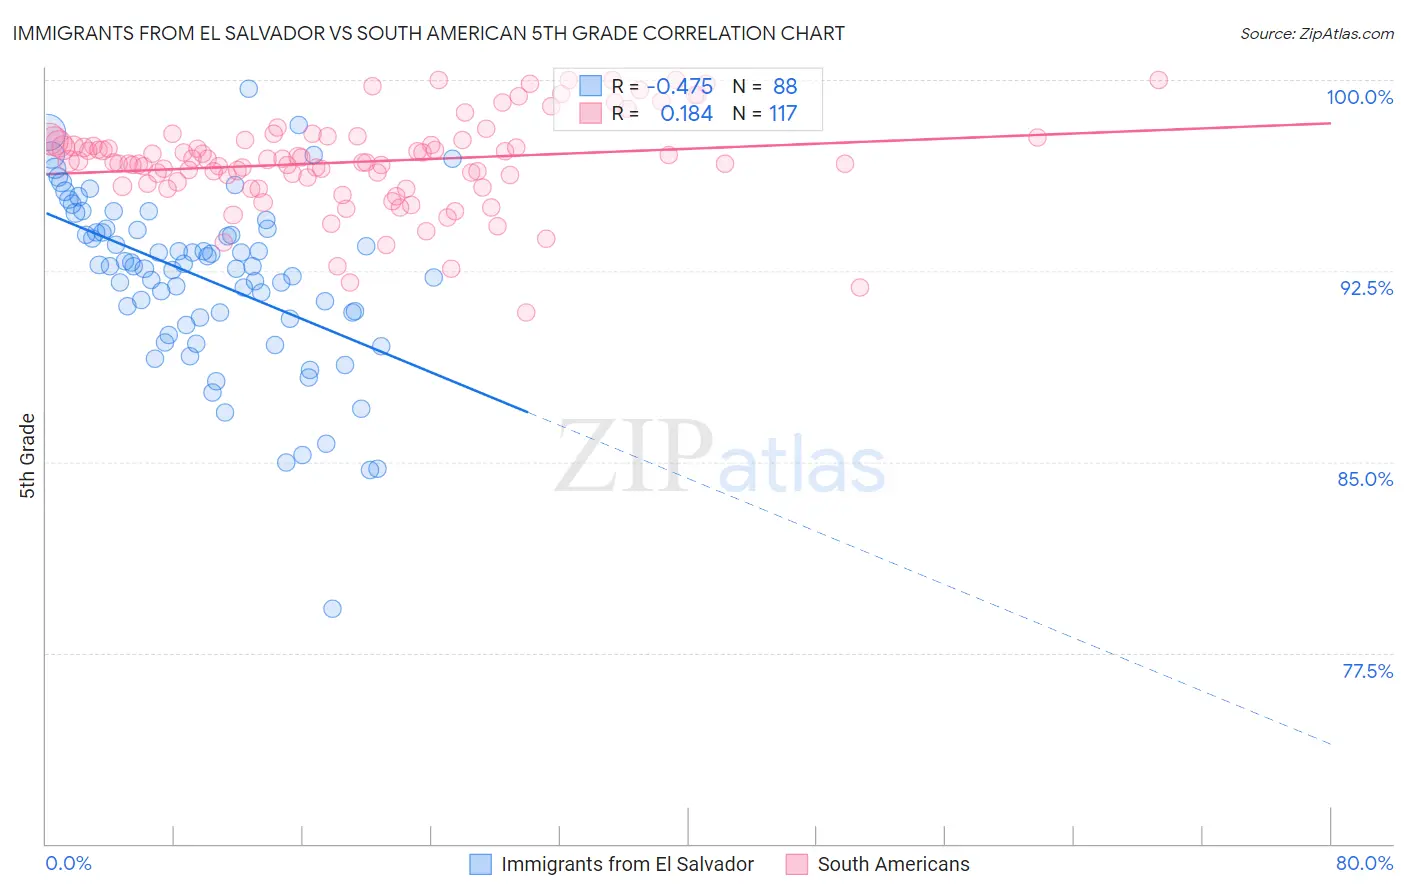
Immigrants from El Salvador vs South American 5th Grade Correlation Chart
The statistical analysis conducted on geographies consisting of 357,823,835 people shows a moderate negative correlation between the proportion of Immigrants from El Salvador and percentage of population with at least 5th grade education in the United States with a correlation coefficient (R) of -0.475 and weighted average of 94.3%. Similarly, the statistical analysis conducted on geographies consisting of 494,178,447 people shows a poor positive correlation between the proportion of South Americans and percentage of population with at least 5th grade education in the United States with a correlation coefficient (R) of 0.184 and weighted average of 96.8%, a difference of 2.6%.
5th Grade Correlation Summary
| Measurement | Immigrants from El Salvador | South American |
| Minimum | 79.2% | 90.9% |
| Maximum | 99.7% | 100.0% |
| Range | 20.4% | 9.1% |
| Mean | 92.2% | 96.8% |
| Median | 92.7% | 96.8% |
| Interquartile 25% (IQ1) | 90.7% | 96.0% |
| Interquartile 75% (IQ3) | 94.1% | 97.6% |
| Interquartile Range (IQR) | 3.5% | 1.7% |
| Standard Deviation (Sample) | 3.4% | 1.8% |
| Standard Deviation (Population) | 3.4% | 1.8% |
Similar Demographics by 5th Grade
Demographics Similar to Immigrants from El Salvador by 5th Grade
In terms of 5th grade, the demographic groups most similar to Immigrants from El Salvador are Spanish American Indian (94.2%, a difference of 0.11%), Immigrants from Guatemala (94.6%, a difference of 0.28%), Salvadoran (94.6%, a difference of 0.29%), Immigrants from Mexico (94.6%, a difference of 0.29%), and Immigrants from Central America (94.7%, a difference of 0.34%).
| Demographics | Rating | Rank | 5th Grade |
| Immigrants | Latin America | 0.0 /100 | #333 | Tragic 95.3% |
| Nepalese | 0.0 /100 | #334 | Tragic 95.2% |
| Mexicans | 0.0 /100 | #335 | Tragic 95.2% |
| Immigrants | Azores | 0.0 /100 | #336 | Tragic 95.1% |
| Central Americans | 0.0 /100 | #337 | Tragic 95.1% |
| Immigrants | Cabo Verde | 0.0 /100 | #338 | Tragic 94.9% |
| Immigrants | Yemen | 0.0 /100 | #339 | Tragic 94.9% |
| Guatemalans | 0.0 /100 | #340 | Tragic 94.8% |
| Yakama | 0.0 /100 | #341 | Tragic 94.8% |
| Immigrants | Central America | 0.0 /100 | #342 | Tragic 94.7% |
| Salvadorans | 0.0 /100 | #343 | Tragic 94.6% |
| Immigrants | Mexico | 0.0 /100 | #344 | Tragic 94.6% |
| Immigrants | Guatemala | 0.0 /100 | #345 | Tragic 94.6% |
| Immigrants | El Salvador | 0.0 /100 | #346 | Tragic 94.3% |
| Spanish American Indians | 0.0 /100 | #347 | Tragic 94.2% |
Demographics Similar to South Americans by 5th Grade
In terms of 5th grade, the demographic groups most similar to South Americans are Immigrants from Congo (96.8%, a difference of 0.0%), Peruvian (96.8%, a difference of 0.010%), Immigrants from Middle Africa (96.8%, a difference of 0.020%), Immigrants from Senegal (96.8%, a difference of 0.020%), and Jamaican (96.9%, a difference of 0.030%).
| Demographics | Rating | Rank | 5th Grade |
| U.S. Virgin Islanders | 1.1 /100 | #248 | Tragic 96.9% |
| Immigrants | Uruguay | 1.0 /100 | #249 | Tragic 96.9% |
| Immigrants | Liberia | 1.0 /100 | #250 | Tragic 96.9% |
| Bolivians | 0.9 /100 | #251 | Tragic 96.9% |
| Jamaicans | 0.9 /100 | #252 | Tragic 96.9% |
| Immigrants | Middle Africa | 0.8 /100 | #253 | Tragic 96.8% |
| Immigrants | Senegal | 0.8 /100 | #254 | Tragic 96.8% |
| South Americans | 0.7 /100 | #255 | Tragic 96.8% |
| Immigrants | Congo | 0.7 /100 | #256 | Tragic 96.8% |
| Peruvians | 0.6 /100 | #257 | Tragic 96.8% |
| Immigrants | Ethiopia | 0.5 /100 | #258 | Tragic 96.8% |
| Immigrants | China | 0.5 /100 | #259 | Tragic 96.8% |
| Immigrants | Jamaica | 0.4 /100 | #260 | Tragic 96.8% |
| Immigrants | Sierra Leone | 0.4 /100 | #261 | Tragic 96.8% |
| Immigrants | Colombia | 0.4 /100 | #262 | Tragic 96.8% |