Immigrants from Korea vs Serbian High School Diploma
COMPARE
Immigrants from Korea
Serbian
High School Diploma
High School Diploma Comparison
Immigrants from Korea
Serbians
90.5%
HIGH SCHOOL DIPLOMA
98.3/ 100
METRIC RATING
98th/ 347
METRIC RANK
91.1%
HIGH SCHOOL DIPLOMA
99.7/ 100
METRIC RATING
55th/ 347
METRIC RANK
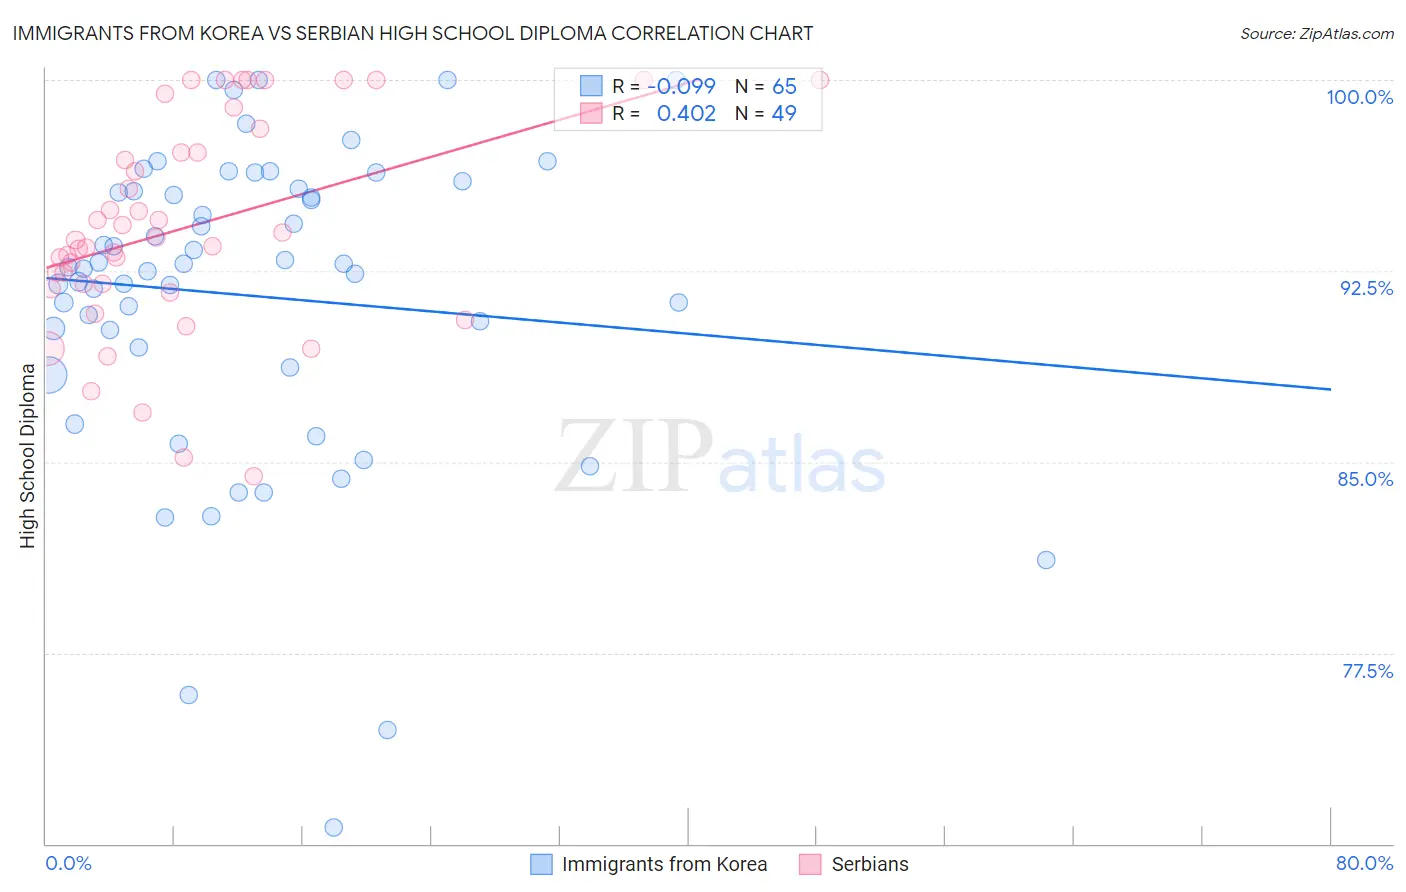
Immigrants from Korea vs Serbian High School Diploma Correlation Chart
The statistical analysis conducted on geographies consisting of 416,280,217 people shows a slight negative correlation between the proportion of Immigrants from Korea and percentage of population with at least high school diploma education in the United States with a correlation coefficient (R) of -0.099 and weighted average of 90.5%. Similarly, the statistical analysis conducted on geographies consisting of 267,640,774 people shows a moderate positive correlation between the proportion of Serbians and percentage of population with at least high school diploma education in the United States with a correlation coefficient (R) of 0.402 and weighted average of 91.1%, a difference of 0.66%.
High School Diploma Correlation Summary
| Measurement | Immigrants from Korea | Serbian |
| Minimum | 70.6% | 84.5% |
| Maximum | 100.0% | 100.0% |
| Range | 29.4% | 15.5% |
| Mean | 91.5% | 94.2% |
| Median | 92.6% | 93.7% |
| Interquartile 25% (IQ1) | 89.1% | 91.9% |
| Interquartile 75% (IQ3) | 95.7% | 97.6% |
| Interquartile Range (IQR) | 6.6% | 5.7% |
| Standard Deviation (Sample) | 6.1% | 4.1% |
| Standard Deviation (Population) | 6.1% | 4.1% |
Similar Demographics by High School Diploma
Demographics Similar to Immigrants from Korea by High School Diploma
In terms of high school diploma, the demographic groups most similar to Immigrants from Korea are Immigrants from Kuwait (90.5%, a difference of 0.0%), Immigrants from Europe (90.5%, a difference of 0.020%), Immigrants from Serbia (90.5%, a difference of 0.030%), Immigrants from North Macedonia (90.5%, a difference of 0.030%), and Immigrants from Israel (90.5%, a difference of 0.040%).
| Demographics | Rating | Rank | High School Diploma |
| South Africans | 98.6 /100 | #91 | Exceptional 90.6% |
| Swiss | 98.6 /100 | #92 | Exceptional 90.6% |
| Immigrants | Western Europe | 98.6 /100 | #93 | Exceptional 90.6% |
| Immigrants | Israel | 98.5 /100 | #94 | Exceptional 90.5% |
| Icelanders | 98.5 /100 | #95 | Exceptional 90.5% |
| Immigrants | Serbia | 98.4 /100 | #96 | Exceptional 90.5% |
| Immigrants | Kuwait | 98.3 /100 | #97 | Exceptional 90.5% |
| Immigrants | Korea | 98.3 /100 | #98 | Exceptional 90.5% |
| Immigrants | Europe | 98.2 /100 | #99 | Exceptional 90.5% |
| Immigrants | North Macedonia | 98.1 /100 | #100 | Exceptional 90.5% |
| Immigrants | Norway | 98.0 /100 | #101 | Exceptional 90.5% |
| Aleuts | 98.0 /100 | #102 | Exceptional 90.4% |
| Immigrants | Romania | 97.8 /100 | #103 | Exceptional 90.4% |
| Immigrants | Croatia | 97.8 /100 | #104 | Exceptional 90.4% |
| Lebanese | 97.4 /100 | #105 | Exceptional 90.4% |
Demographics Similar to Serbians by High School Diploma
In terms of high school diploma, the demographic groups most similar to Serbians are Macedonian (91.1%, a difference of 0.010%), Immigrants from Sweden (91.1%, a difference of 0.030%), Immigrants from Belgium (91.1%, a difference of 0.030%), Immigrants from Canada (91.1%, a difference of 0.030%), and New Zealander (91.1%, a difference of 0.040%).
| Demographics | Rating | Rank | High School Diploma |
| Belgians | 99.8 /100 | #48 | Exceptional 91.2% |
| Bhutanese | 99.8 /100 | #49 | Exceptional 91.2% |
| Welsh | 99.8 /100 | #50 | Exceptional 91.2% |
| New Zealanders | 99.7 /100 | #51 | Exceptional 91.1% |
| Immigrants | Sweden | 99.7 /100 | #52 | Exceptional 91.1% |
| Immigrants | Belgium | 99.7 /100 | #53 | Exceptional 91.1% |
| Macedonians | 99.7 /100 | #54 | Exceptional 91.1% |
| Serbians | 99.7 /100 | #55 | Exceptional 91.1% |
| Immigrants | Canada | 99.7 /100 | #56 | Exceptional 91.1% |
| Zimbabweans | 99.7 /100 | #57 | Exceptional 91.1% |
| Slavs | 99.7 /100 | #58 | Exceptional 91.0% |
| Immigrants | North America | 99.7 /100 | #59 | Exceptional 91.0% |
| Immigrants | Japan | 99.6 /100 | #60 | Exceptional 91.0% |
| Immigrants | Taiwan | 99.6 /100 | #61 | Exceptional 91.0% |
| Austrians | 99.6 /100 | #62 | Exceptional 91.0% |