Immigrants from Ecuador vs New Zealander 7th Grade
COMPARE
Immigrants from Ecuador
New Zealander
7th Grade
7th Grade Comparison
Immigrants from Ecuador
New Zealanders
93.7%
7TH GRADE
0.0/ 100
METRIC RATING
318th/ 347
METRIC RANK
96.8%
7TH GRADE
99.6/ 100
METRIC RATING
70th/ 347
METRIC RANK
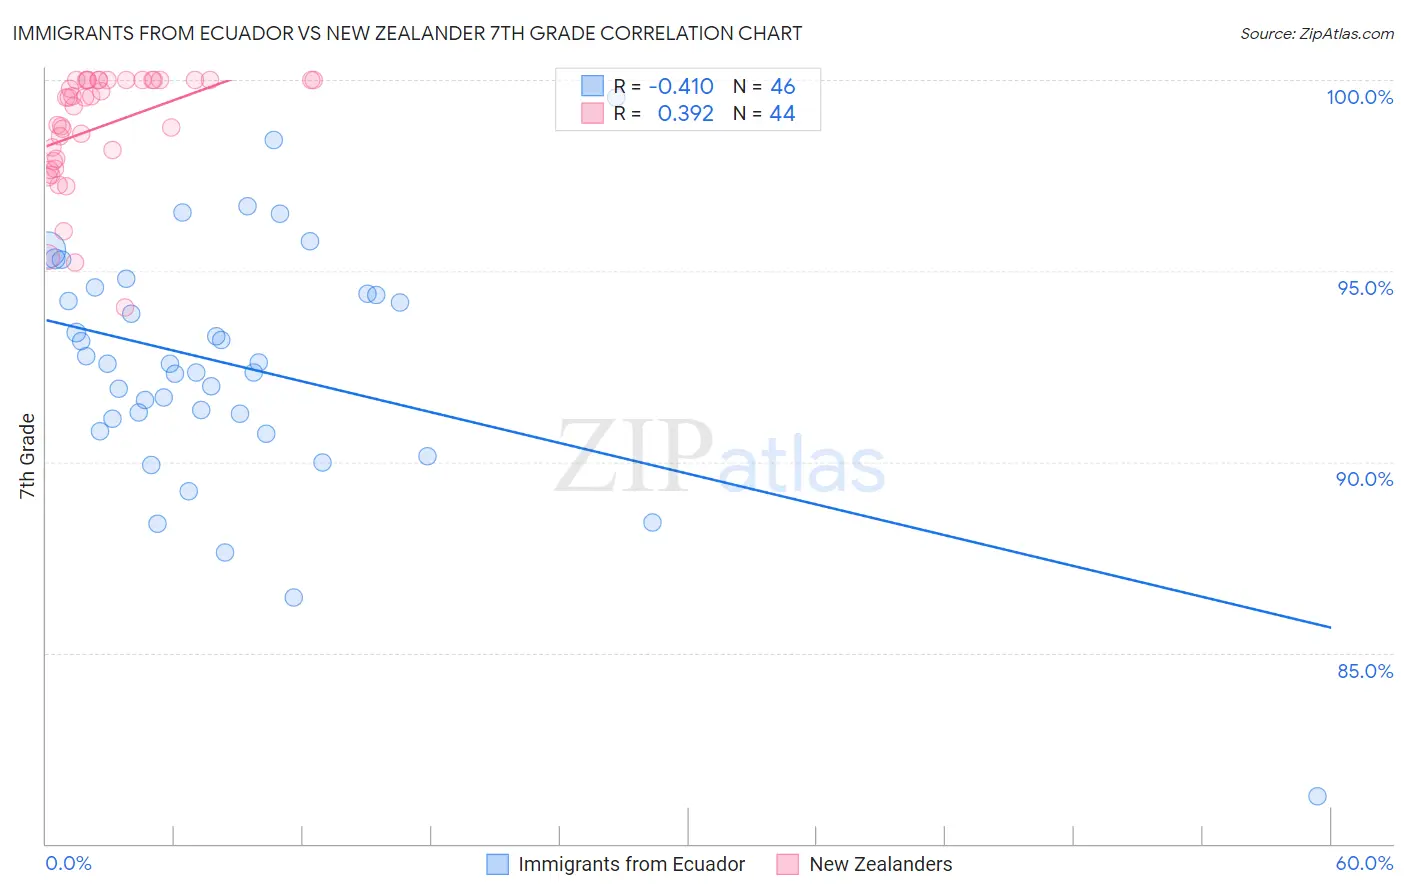
Immigrants from Ecuador vs New Zealander 7th Grade Correlation Chart
The statistical analysis conducted on geographies consisting of 270,907,929 people shows a moderate negative correlation between the proportion of Immigrants from Ecuador and percentage of population with at least 7th grade education in the United States with a correlation coefficient (R) of -0.410 and weighted average of 93.7%. Similarly, the statistical analysis conducted on geographies consisting of 106,912,544 people shows a mild positive correlation between the proportion of New Zealanders and percentage of population with at least 7th grade education in the United States with a correlation coefficient (R) of 0.392 and weighted average of 96.8%, a difference of 3.3%.
7th Grade Correlation Summary
| Measurement | Immigrants from Ecuador | New Zealander |
| Minimum | 81.2% | 94.0% |
| Maximum | 99.5% | 100.0% |
| Range | 18.3% | 6.0% |
| Mean | 92.5% | 98.8% |
| Median | 92.6% | 99.5% |
| Interquartile 25% (IQ1) | 91.1% | 97.9% |
| Interquartile 75% (IQ3) | 94.4% | 100.0% |
| Interquartile Range (IQR) | 3.3% | 2.1% |
| Standard Deviation (Sample) | 3.2% | 1.5% |
| Standard Deviation (Population) | 3.2% | 1.5% |
Similar Demographics by 7th Grade
Demographics Similar to Immigrants from Ecuador by 7th Grade
In terms of 7th grade, the demographic groups most similar to Immigrants from Ecuador are Immigrants from Cambodia (93.7%, a difference of 0.030%), Immigrants from Cuba (93.8%, a difference of 0.080%), Immigrants from Vietnam (93.9%, a difference of 0.16%), Vietnamese (93.9%, a difference of 0.19%), and Immigrants from Fiji (93.5%, a difference of 0.21%).
| Demographics | Rating | Rank | 7th Grade |
| Puerto Ricans | 0.0 /100 | #311 | Tragic 94.0% |
| Immigrants | Immigrants | 0.0 /100 | #312 | Tragic 94.0% |
| Immigrants | Bangladesh | 0.0 /100 | #313 | Tragic 94.0% |
| Japanese | 0.0 /100 | #314 | Tragic 94.0% |
| Vietnamese | 0.0 /100 | #315 | Tragic 93.9% |
| Immigrants | Vietnam | 0.0 /100 | #316 | Tragic 93.9% |
| Immigrants | Cuba | 0.0 /100 | #317 | Tragic 93.8% |
| Immigrants | Ecuador | 0.0 /100 | #318 | Tragic 93.7% |
| Immigrants | Cambodia | 0.0 /100 | #319 | Tragic 93.7% |
| Immigrants | Fiji | 0.0 /100 | #320 | Tragic 93.5% |
| Belizeans | 0.0 /100 | #321 | Tragic 93.5% |
| Nicaraguans | 0.0 /100 | #322 | Tragic 93.5% |
| Immigrants | Belize | 0.0 /100 | #323 | Tragic 93.4% |
| Dominicans | 0.0 /100 | #324 | Tragic 93.3% |
| Central American Indians | 0.0 /100 | #325 | Tragic 93.3% |
Demographics Similar to New Zealanders by 7th Grade
In terms of 7th grade, the demographic groups most similar to New Zealanders are Iranian (96.8%, a difference of 0.0%), Immigrants from Lithuania (96.8%, a difference of 0.010%), Cajun (96.8%, a difference of 0.010%), Immigrants from India (96.9%, a difference of 0.030%), and Arapaho (96.8%, a difference of 0.030%).
| Demographics | Rating | Rank | 7th Grade |
| Immigrants | Northern Europe | 99.7 /100 | #63 | Exceptional 96.9% |
| Immigrants | Austria | 99.7 /100 | #64 | Exceptional 96.9% |
| Canadians | 99.7 /100 | #65 | Exceptional 96.9% |
| Ukrainians | 99.7 /100 | #66 | Exceptional 96.9% |
| Native Hawaiians | 99.7 /100 | #67 | Exceptional 96.9% |
| Immigrants | India | 99.6 /100 | #68 | Exceptional 96.9% |
| Iranians | 99.6 /100 | #69 | Exceptional 96.8% |
| New Zealanders | 99.6 /100 | #70 | Exceptional 96.8% |
| Immigrants | Lithuania | 99.6 /100 | #71 | Exceptional 96.8% |
| Cajuns | 99.5 /100 | #72 | Exceptional 96.8% |
| Arapaho | 99.5 /100 | #73 | Exceptional 96.8% |
| Immigrants | England | 99.5 /100 | #74 | Exceptional 96.8% |
| Zimbabweans | 99.5 /100 | #75 | Exceptional 96.8% |
| Immigrants | Ireland | 99.4 /100 | #76 | Exceptional 96.8% |
| Cherokee | 99.4 /100 | #77 | Exceptional 96.8% |