Immigrants from Ecuador vs Sri Lankan 7th Grade
COMPARE
Immigrants from Ecuador
Sri Lankan
7th Grade
7th Grade Comparison
Immigrants from Ecuador
Sri Lankans
93.7%
7TH GRADE
0.0/ 100
METRIC RATING
318th/ 347
METRIC RANK
94.4%
7TH GRADE
0.0/ 100
METRIC RATING
303rd/ 347
METRIC RANK
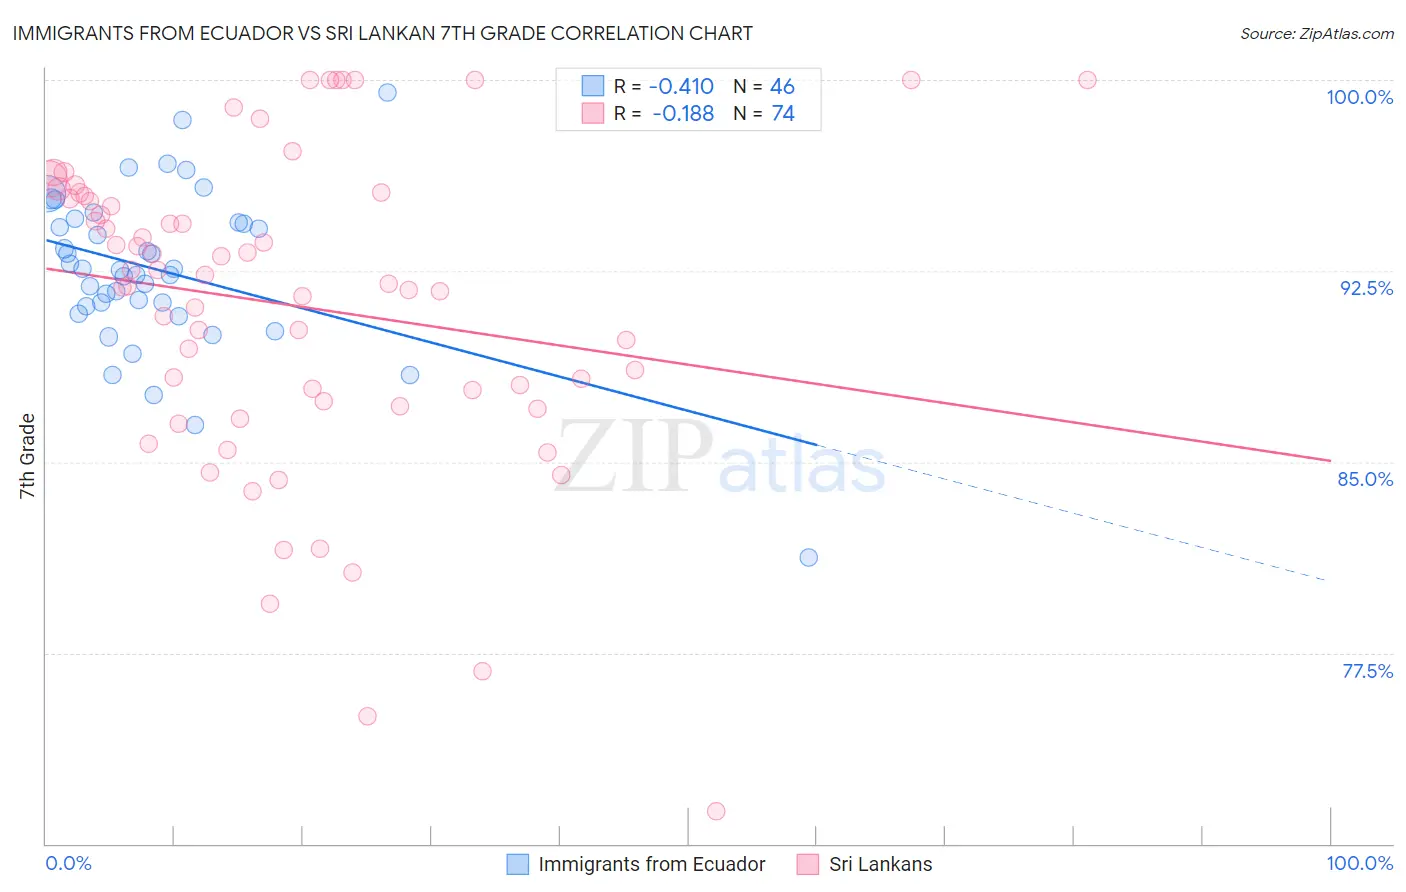
Immigrants from Ecuador vs Sri Lankan 7th Grade Correlation Chart
The statistical analysis conducted on geographies consisting of 270,907,929 people shows a moderate negative correlation between the proportion of Immigrants from Ecuador and percentage of population with at least 7th grade education in the United States with a correlation coefficient (R) of -0.410 and weighted average of 93.7%. Similarly, the statistical analysis conducted on geographies consisting of 440,593,938 people shows a poor negative correlation between the proportion of Sri Lankans and percentage of population with at least 7th grade education in the United States with a correlation coefficient (R) of -0.188 and weighted average of 94.4%, a difference of 0.69%.
7th Grade Correlation Summary
| Measurement | Immigrants from Ecuador | Sri Lankan |
| Minimum | 81.2% | 71.3% |
| Maximum | 99.5% | 100.0% |
| Range | 18.3% | 28.7% |
| Mean | 92.5% | 91.2% |
| Median | 92.6% | 92.2% |
| Interquartile 25% (IQ1) | 91.1% | 87.4% |
| Interquartile 75% (IQ3) | 94.4% | 95.5% |
| Interquartile Range (IQR) | 3.3% | 8.1% |
| Standard Deviation (Sample) | 3.2% | 6.2% |
| Standard Deviation (Population) | 3.2% | 6.2% |
Demographics Similar to Immigrants from Ecuador and Sri Lankans by 7th Grade
In terms of 7th grade, the demographic groups most similar to Immigrants from Ecuador are Immigrants from Cambodia (93.7%, a difference of 0.030%), Immigrants from Cuba (93.8%, a difference of 0.080%), Immigrants from Vietnam (93.9%, a difference of 0.16%), Vietnamese (93.9%, a difference of 0.19%), and Immigrants from Fiji (93.5%, a difference of 0.21%). Similarly, the demographic groups most similar to Sri Lankans are Immigrants from Haiti (94.3%, a difference of 0.030%), Guyanese (94.3%, a difference of 0.060%), Immigrants from Laos (94.5%, a difference of 0.080%), Immigrants from Dominica (94.5%, a difference of 0.090%), and Immigrants from Burma/Myanmar (94.5%, a difference of 0.12%).
| Demographics | Rating | Rank | 7th Grade |
| Immigrants | Burma/Myanmar | 0.0 /100 | #300 | Tragic 94.5% |
| Immigrants | Dominica | 0.0 /100 | #301 | Tragic 94.5% |
| Immigrants | Laos | 0.0 /100 | #302 | Tragic 94.5% |
| Sri Lankans | 0.0 /100 | #303 | Tragic 94.4% |
| Immigrants | Haiti | 0.0 /100 | #304 | Tragic 94.3% |
| Guyanese | 0.0 /100 | #305 | Tragic 94.3% |
| Immigrants | Guyana | 0.0 /100 | #306 | Tragic 94.2% |
| Immigrants | Portugal | 0.0 /100 | #307 | Tragic 94.2% |
| Cape Verdeans | 0.0 /100 | #308 | Tragic 94.1% |
| Ecuadorians | 0.0 /100 | #309 | Tragic 94.0% |
| Immigrants | Caribbean | 0.0 /100 | #310 | Tragic 94.0% |
| Puerto Ricans | 0.0 /100 | #311 | Tragic 94.0% |
| Immigrants | Immigrants | 0.0 /100 | #312 | Tragic 94.0% |
| Immigrants | Bangladesh | 0.0 /100 | #313 | Tragic 94.0% |
| Japanese | 0.0 /100 | #314 | Tragic 94.0% |
| Vietnamese | 0.0 /100 | #315 | Tragic 93.9% |
| Immigrants | Vietnam | 0.0 /100 | #316 | Tragic 93.9% |
| Immigrants | Cuba | 0.0 /100 | #317 | Tragic 93.8% |
| Immigrants | Ecuador | 0.0 /100 | #318 | Tragic 93.7% |
| Immigrants | Cambodia | 0.0 /100 | #319 | Tragic 93.7% |
| Immigrants | Fiji | 0.0 /100 | #320 | Tragic 93.5% |