Immigrants from Ecuador vs Cherokee Female Unemployment
COMPARE
Immigrants from Ecuador
Cherokee
Female Unemployment
Female Unemployment Comparison
Immigrants from Ecuador
Cherokee
6.4%
FEMALE UNEMPLOYMENT
0.0/ 100
METRIC RATING
314th/ 347
METRIC RANK
5.3%
FEMALE UNEMPLOYMENT
30.8/ 100
METRIC RATING
191st/ 347
METRIC RANK
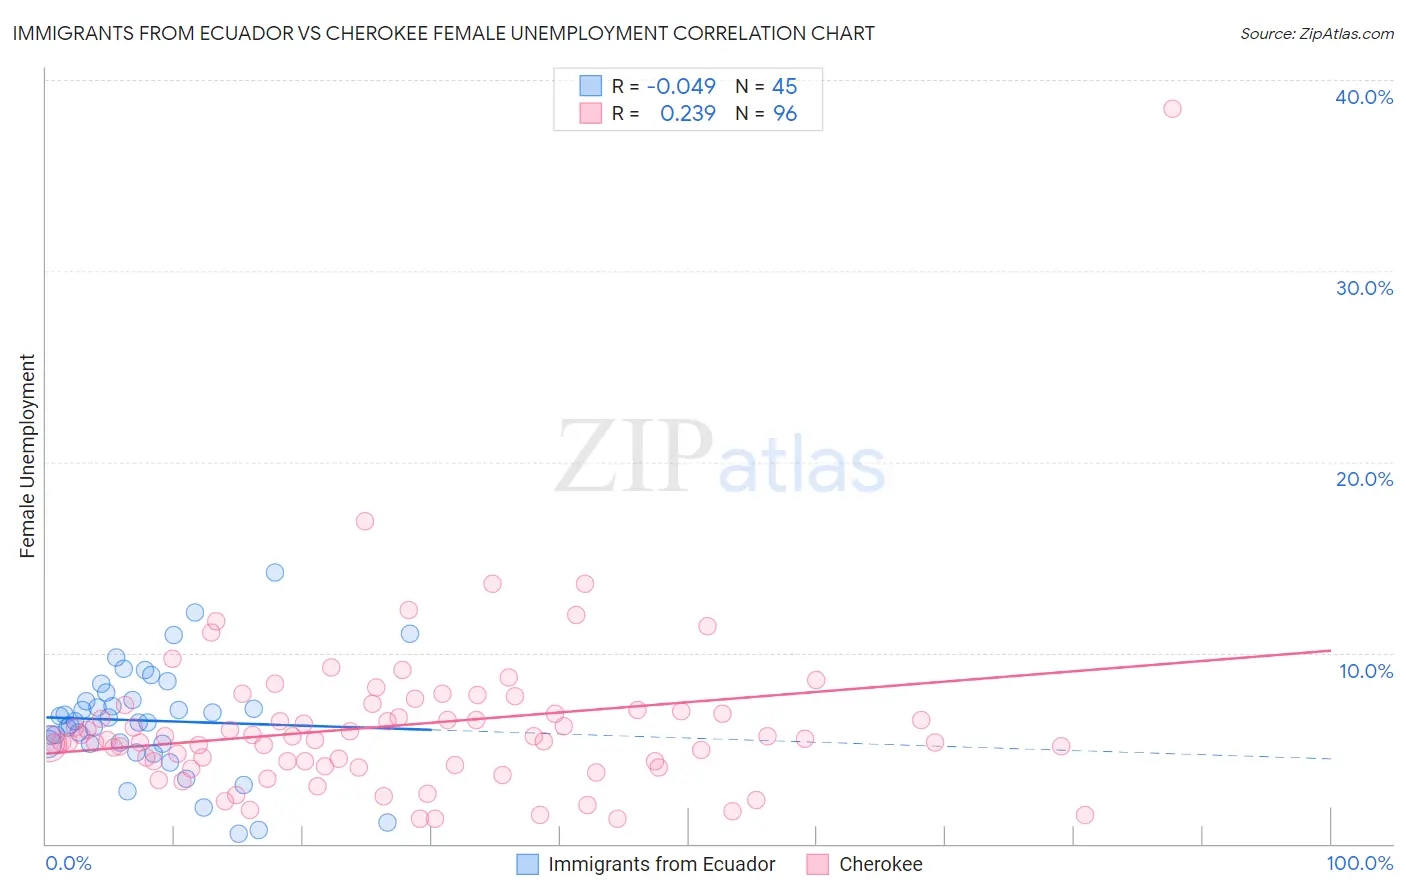
Immigrants from Ecuador vs Cherokee Female Unemployment Correlation Chart
The statistical analysis conducted on geographies consisting of 270,415,803 people shows no correlation between the proportion of Immigrants from Ecuador and unemploymnet rate among females in the United States with a correlation coefficient (R) of -0.049 and weighted average of 6.4%. Similarly, the statistical analysis conducted on geographies consisting of 487,346,923 people shows a weak positive correlation between the proportion of Cherokee and unemploymnet rate among females in the United States with a correlation coefficient (R) of 0.239 and weighted average of 5.3%, a difference of 19.5%.
Female Unemployment Correlation Summary
| Measurement | Immigrants from Ecuador | Cherokee |
| Minimum | 0.51% | 1.3% |
| Maximum | 14.2% | 38.5% |
| Range | 13.7% | 37.2% |
| Mean | 6.4% | 6.2% |
| Median | 6.4% | 5.5% |
| Interquartile 25% (IQ1) | 5.2% | 4.2% |
| Interquartile 75% (IQ3) | 7.7% | 7.0% |
| Interquartile Range (IQR) | 2.5% | 2.8% |
| Standard Deviation (Sample) | 2.8% | 4.4% |
| Standard Deviation (Population) | 2.8% | 4.4% |
Similar Demographics by Female Unemployment
Demographics Similar to Immigrants from Ecuador by Female Unemployment
In terms of female unemployment, the demographic groups most similar to Immigrants from Ecuador are Belizean (6.3%, a difference of 0.23%), Immigrants from Grenada (6.3%, a difference of 0.24%), Pueblo (6.4%, a difference of 0.31%), Houma (6.4%, a difference of 0.60%), and Immigrants from Mexico (6.3%, a difference of 0.90%).
| Demographics | Rating | Rank | Female Unemployment |
| Shoshone | 0.0 /100 | #307 | Tragic 6.2% |
| Hispanics or Latinos | 0.0 /100 | #308 | Tragic 6.2% |
| Ecuadorians | 0.0 /100 | #309 | Tragic 6.3% |
| Central American Indians | 0.0 /100 | #310 | Tragic 6.3% |
| Immigrants | Mexico | 0.0 /100 | #311 | Tragic 6.3% |
| Immigrants | Grenada | 0.0 /100 | #312 | Tragic 6.3% |
| Belizeans | 0.0 /100 | #313 | Tragic 6.3% |
| Immigrants | Ecuador | 0.0 /100 | #314 | Tragic 6.4% |
| Pueblo | 0.0 /100 | #315 | Tragic 6.4% |
| Houma | 0.0 /100 | #316 | Tragic 6.4% |
| Immigrants | St. Vincent and the Grenadines | 0.0 /100 | #317 | Tragic 6.4% |
| British West Indians | 0.0 /100 | #318 | Tragic 6.4% |
| Immigrants | Bangladesh | 0.0 /100 | #319 | Tragic 6.5% |
| Immigrants | Dominica | 0.0 /100 | #320 | Tragic 6.5% |
| Blacks/African Americans | 0.0 /100 | #321 | Tragic 6.5% |
Demographics Similar to Cherokee by Female Unemployment
In terms of female unemployment, the demographic groups most similar to Cherokee are Ugandan (5.3%, a difference of 0.030%), Portuguese (5.3%, a difference of 0.16%), Costa Rican (5.3%, a difference of 0.20%), Afghan (5.3%, a difference of 0.21%), and Arab (5.3%, a difference of 0.23%).
| Demographics | Rating | Rank | Female Unemployment |
| Immigrants | Ukraine | 40.1 /100 | #184 | Average 5.3% |
| Malaysians | 40.1 /100 | #185 | Average 5.3% |
| Immigrants | Belarus | 39.4 /100 | #186 | Fair 5.3% |
| Immigrants | Albania | 35.4 /100 | #187 | Fair 5.3% |
| Afghans | 33.9 /100 | #188 | Fair 5.3% |
| Costa Ricans | 33.8 /100 | #189 | Fair 5.3% |
| Ugandans | 31.2 /100 | #190 | Fair 5.3% |
| Cherokee | 30.8 /100 | #191 | Fair 5.3% |
| Portuguese | 28.6 /100 | #192 | Fair 5.3% |
| Arabs | 27.7 /100 | #193 | Fair 5.3% |
| Colombians | 27.0 /100 | #194 | Fair 5.3% |
| Immigrants | Colombia | 26.2 /100 | #195 | Fair 5.3% |
| Spaniards | 25.2 /100 | #196 | Fair 5.3% |
| Alsatians | 23.9 /100 | #197 | Fair 5.3% |
| Tsimshian | 23.1 /100 | #198 | Fair 5.4% |