Immigrants from Spain vs Cherokee Professional Degree
COMPARE
Immigrants from Spain
Cherokee
Professional Degree
Professional Degree Comparison
Immigrants from Spain
Cherokee
6.3%
PROFESSIONAL DEGREE
100.0/ 100
METRIC RATING
24th/ 347
METRIC RANK
3.3%
PROFESSIONAL DEGREE
0.1/ 100
METRIC RATING
311th/ 347
METRIC RANK
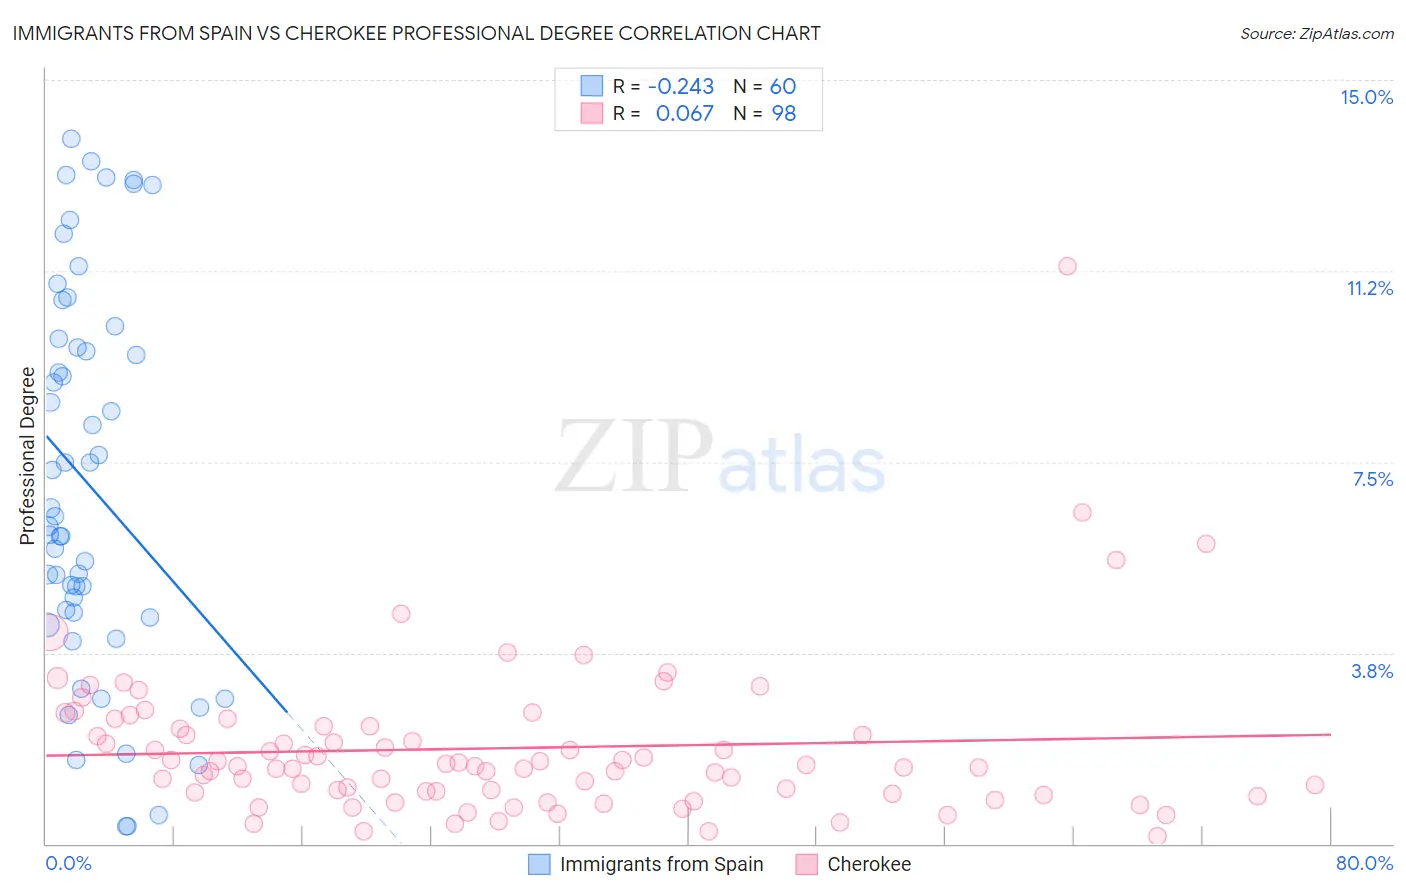
Immigrants from Spain vs Cherokee Professional Degree Correlation Chart
The statistical analysis conducted on geographies consisting of 239,491,519 people shows a weak negative correlation between the proportion of Immigrants from Spain and percentage of population with at least professional degree education in the United States with a correlation coefficient (R) of -0.243 and weighted average of 6.3%. Similarly, the statistical analysis conducted on geographies consisting of 489,212,297 people shows a slight positive correlation between the proportion of Cherokee and percentage of population with at least professional degree education in the United States with a correlation coefficient (R) of 0.067 and weighted average of 3.3%, a difference of 92.2%.
Professional Degree Correlation Summary
| Measurement | Immigrants from Spain | Cherokee |
| Minimum | 0.34% | 0.14% |
| Maximum | 13.8% | 11.3% |
| Range | 13.5% | 11.2% |
| Mean | 7.0% | 1.9% |
| Median | 6.3% | 1.5% |
| Interquartile 25% (IQ1) | 4.5% | 1.0% |
| Interquartile 75% (IQ3) | 9.8% | 2.3% |
| Interquartile Range (IQR) | 5.3% | 1.3% |
| Standard Deviation (Sample) | 3.7% | 1.5% |
| Standard Deviation (Population) | 3.7% | 1.5% |
Similar Demographics by Professional Degree
Demographics Similar to Immigrants from Spain by Professional Degree
In terms of professional degree, the demographic groups most similar to Immigrants from Spain are Russian (6.3%, a difference of 0.040%), Immigrants from Ireland (6.3%, a difference of 0.49%), Immigrants from Japan (6.4%, a difference of 0.51%), Immigrants from Hong Kong (6.4%, a difference of 1.3%), and Latvian (6.2%, a difference of 1.4%).
| Demographics | Rating | Rank | Professional Degree |
| Immigrants | Eastern Asia | 100.0 /100 | #17 | Exceptional 6.6% |
| Soviet Union | 100.0 /100 | #18 | Exceptional 6.6% |
| Indians (Asian) | 100.0 /100 | #19 | Exceptional 6.5% |
| Immigrants | Denmark | 100.0 /100 | #20 | Exceptional 6.4% |
| Immigrants | Hong Kong | 100.0 /100 | #21 | Exceptional 6.4% |
| Immigrants | Japan | 100.0 /100 | #22 | Exceptional 6.4% |
| Russians | 100.0 /100 | #23 | Exceptional 6.3% |
| Immigrants | Spain | 100.0 /100 | #24 | Exceptional 6.3% |
| Immigrants | Ireland | 100.0 /100 | #25 | Exceptional 6.3% |
| Latvians | 100.0 /100 | #26 | Exceptional 6.2% |
| Immigrants | Northern Europe | 100.0 /100 | #27 | Exceptional 6.2% |
| Turks | 100.0 /100 | #28 | Exceptional 6.2% |
| Immigrants | Sri Lanka | 100.0 /100 | #29 | Exceptional 6.2% |
| Immigrants | Turkey | 100.0 /100 | #30 | Exceptional 6.2% |
| Immigrants | India | 100.0 /100 | #31 | Exceptional 6.2% |
Demographics Similar to Cherokee by Professional Degree
In terms of professional degree, the demographic groups most similar to Cherokee are Immigrants from Latin America (3.3%, a difference of 0.15%), Pima (3.3%, a difference of 0.47%), Shoshone (3.3%, a difference of 0.48%), Sioux (3.3%, a difference of 0.59%), and Yuman (3.3%, a difference of 0.60%).
| Demographics | Rating | Rank | Professional Degree |
| Cajuns | 0.2 /100 | #304 | Tragic 3.4% |
| Chickasaw | 0.1 /100 | #305 | Tragic 3.4% |
| Cape Verdeans | 0.1 /100 | #306 | Tragic 3.4% |
| Samoans | 0.1 /100 | #307 | Tragic 3.3% |
| Shoshone | 0.1 /100 | #308 | Tragic 3.3% |
| Pima | 0.1 /100 | #309 | Tragic 3.3% |
| Immigrants | Latin America | 0.1 /100 | #310 | Tragic 3.3% |
| Cherokee | 0.1 /100 | #311 | Tragic 3.3% |
| Sioux | 0.1 /100 | #312 | Tragic 3.3% |
| Yuman | 0.1 /100 | #313 | Tragic 3.3% |
| Mexican American Indians | 0.1 /100 | #314 | Tragic 3.3% |
| Immigrants | Laos | 0.1 /100 | #315 | Tragic 3.2% |
| Puerto Ricans | 0.1 /100 | #316 | Tragic 3.2% |
| Nepalese | 0.1 /100 | #317 | Tragic 3.2% |
| Immigrants | Micronesia | 0.1 /100 | #318 | Tragic 3.2% |