Immigrants from Ecuador vs Israeli College, 1 year or more
COMPARE
Immigrants from Ecuador
Israeli
College, 1 year or more
College, 1 year or more Comparison
Immigrants from Ecuador
Israelis
53.4%
COLLEGE, 1 YEAR OR MORE
0.0/ 100
METRIC RATING
289th/ 347
METRIC RANK
65.3%
COLLEGE, 1 YEAR OR MORE
99.9/ 100
METRIC RATING
34th/ 347
METRIC RANK
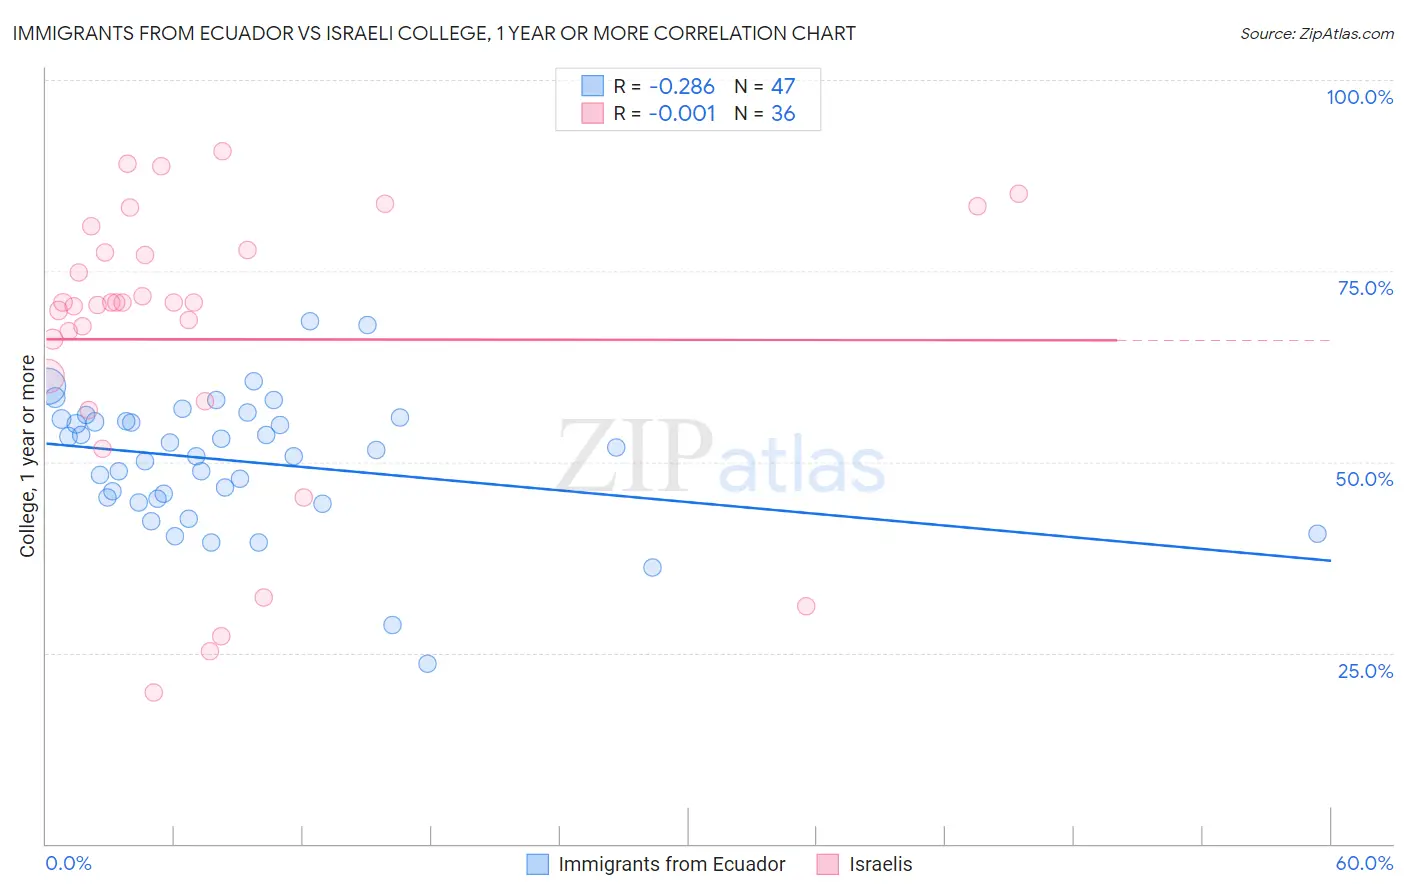
Immigrants from Ecuador vs Israeli College, 1 year or more Correlation Chart
The statistical analysis conducted on geographies consisting of 271,020,679 people shows a weak negative correlation between the proportion of Immigrants from Ecuador and percentage of population with at least college, 1 year or more education in the United States with a correlation coefficient (R) of -0.286 and weighted average of 53.4%. Similarly, the statistical analysis conducted on geographies consisting of 211,218,479 people shows no correlation between the proportion of Israelis and percentage of population with at least college, 1 year or more education in the United States with a correlation coefficient (R) of -0.001 and weighted average of 65.3%, a difference of 22.3%.
College, 1 year or more Correlation Summary
| Measurement | Immigrants from Ecuador | Israeli |
| Minimum | 23.5% | 19.8% |
| Maximum | 68.5% | 90.6% |
| Range | 44.9% | 70.9% |
| Mean | 50.1% | 66.0% |
| Median | 51.6% | 70.8% |
| Interquartile 25% (IQ1) | 45.2% | 59.5% |
| Interquartile 75% (IQ3) | 55.6% | 77.6% |
| Interquartile Range (IQR) | 10.4% | 18.0% |
| Standard Deviation (Sample) | 8.7% | 18.8% |
| Standard Deviation (Population) | 8.6% | 18.5% |
Similar Demographics by College, 1 year or more
Demographics Similar to Immigrants from Ecuador by College, 1 year or more
In terms of college, 1 year or more, the demographic groups most similar to Immigrants from Ecuador are Alaska Native (53.4%, a difference of 0.0%), Alaskan Athabascan (53.4%, a difference of 0.020%), Cuban (53.4%, a difference of 0.070%), Immigrants from Belize (53.5%, a difference of 0.17%), and Chickasaw (53.3%, a difference of 0.20%).
| Demographics | Rating | Rank | College, 1 year or more |
| Guyanese | 0.1 /100 | #282 | Tragic 54.1% |
| Nicaraguans | 0.1 /100 | #283 | Tragic 53.9% |
| Ute | 0.1 /100 | #284 | Tragic 53.8% |
| Immigrants | Guyana | 0.1 /100 | #285 | Tragic 53.5% |
| Central American Indians | 0.1 /100 | #286 | Tragic 53.5% |
| Immigrants | Belize | 0.1 /100 | #287 | Tragic 53.5% |
| Alaska Natives | 0.0 /100 | #288 | Tragic 53.4% |
| Immigrants | Ecuador | 0.0 /100 | #289 | Tragic 53.4% |
| Alaskan Athabascans | 0.0 /100 | #290 | Tragic 53.4% |
| Cubans | 0.0 /100 | #291 | Tragic 53.4% |
| Chickasaw | 0.0 /100 | #292 | Tragic 53.3% |
| Blacks/African Americans | 0.0 /100 | #293 | Tragic 53.3% |
| Cherokee | 0.0 /100 | #294 | Tragic 53.2% |
| Yaqui | 0.0 /100 | #295 | Tragic 53.2% |
| Sioux | 0.0 /100 | #296 | Tragic 53.0% |
Demographics Similar to Israelis by College, 1 year or more
In terms of college, 1 year or more, the demographic groups most similar to Israelis are Immigrants from Sri Lanka (65.4%, a difference of 0.12%), Immigrants from Turkey (65.2%, a difference of 0.20%), Bulgarian (65.5%, a difference of 0.27%), Immigrants from South Africa (65.1%, a difference of 0.28%), and Russian (65.1%, a difference of 0.28%).
| Demographics | Rating | Rank | College, 1 year or more |
| Immigrants | Ireland | 100.0 /100 | #27 | Exceptional 65.9% |
| Immigrants | France | 100.0 /100 | #28 | Exceptional 65.8% |
| Immigrants | Northern Europe | 100.0 /100 | #29 | Exceptional 65.6% |
| Immigrants | Denmark | 100.0 /100 | #30 | Exceptional 65.6% |
| Turks | 100.0 /100 | #31 | Exceptional 65.5% |
| Bulgarians | 100.0 /100 | #32 | Exceptional 65.5% |
| Immigrants | Sri Lanka | 99.9 /100 | #33 | Exceptional 65.4% |
| Israelis | 99.9 /100 | #34 | Exceptional 65.3% |
| Immigrants | Turkey | 99.9 /100 | #35 | Exceptional 65.2% |
| Immigrants | South Africa | 99.9 /100 | #36 | Exceptional 65.1% |
| Russians | 99.9 /100 | #37 | Exceptional 65.1% |
| Immigrants | Saudi Arabia | 99.9 /100 | #38 | Exceptional 65.0% |
| Estonians | 99.9 /100 | #39 | Exceptional 65.0% |
| Immigrants | Kuwait | 99.9 /100 | #40 | Exceptional 65.0% |
| Mongolians | 99.9 /100 | #41 | Exceptional 64.8% |