Immigrants from Eastern Europe vs Seminole 3rd Grade

COMPARE

Immigrants from Eastern Europe
Race
Ancestry
AfghanAfricanAlaska NativeAlaskan AthabascanAlbanianAleutAlsatianAmericanApacheArabArapahoArgentineanArmenianAssyrian/Chaldean/SyriacAustralianAustrianBahamianBangladeshiBarbadianBasqueBelgianBelizeanBermudanBhutaneseBlackfeetBolivianBrazilianBritishBritish West IndianBulgarianBurmeseCajunCambodianCanadianCape VerdeanCarpatho RusynCelticCentral AmericanCentral American IndianCherokeeCheyenneChickasawChileanChineseChippewaChoctawColombianColvilleComancheCosta RicanCreeCreekCroatianCrowCubanCypriotCzechCzechoslovakianDanishDelawareDominicanDutchDutch West IndianEastern EuropeanEcuadorianEgyptianEnglishEstonianEthiopianEuropeanFijianFilipinoFinnishFrenchFrench American IndianFrench CanadianGermanGerman RussianGhanaianGreekGuamanian/ChamorroGuatemalanGuyaneseHaitianHmongHonduranHopiHoumaHungarianIcelanderIndian (Asian)IndonesianInupiatIranianIraqiIrishIroquoisIsraeliItalianJamaicanJapaneseJordanianKenyanKiowaKoreanLaotianLatvianLebaneseLiberianLithuanianLumbeeLuxembourgerMacedonianMalaysianMalteseMarshalleseMenomineeMexicanMexican American IndianMongolianMoroccanNative HawaiianNavajoNepaleseNew ZealanderNicaraguanNigerianNorthern EuropeanNorwegianOkinawanOsageOttawaPaiutePakistaniPalestinianPanamanianParaguayanPennsylvania GermanPeruvianPimaPolishPortuguesePotawatomiPuebloPuerto RicanPuget Sound SalishRomanianRussianSalvadoranSamoanScandinavianScotch-IrishScottishSenegaleseSerbianShoshoneSierra LeoneanSiouxSlavicSlovakSloveneSomaliSouth AfricanSouth AmericanSouth American IndianSoviet UnionSpaniardSpanishSpanish AmericanSpanish American IndianSri LankanSubsaharan AfricanSudaneseSwedishSwissSyrianTaiwaneseThaiTlingit-HaidaTohono O'OdhamTonganTrinidadian and TobagonianTsimshianTurkishU.S. Virgin IslanderUgandanUkrainianUruguayanUteVenezuelanVietnameseWelshWest IndianYakamaYaquiYugoslavianYumanYup'ikZimbabwean
Immigration
NonimmigrantsImmigrantsAfghanistanAfricaAlbaniaArgentinaArmeniaAsiaAustraliaAustriaBahamasBangladeshBarbadosBelarusBelgiumBelizeBoliviaBosnia and HerzegovinaBrazilBulgariaBurma/MyanmarCabo VerdeCambodiaCameroonCanadaCaribbeanCentral AmericaChileChinaColombiaCongoCosta RicaCroatiaCubaCzechoslovakiaDenmarkDominicaDominican RepublicEastern AfricaEastern AsiaEastern EuropeEcuadorEgyptEl SalvadorEnglandEritreaEthiopiaEuropeFijiFranceGermanyGhanaGreeceGrenadaGuatemalaGuyanaHaitiHondurasHong KongHungaryIndiaIndonesiaIranIraqIrelandIsraelItalyJamaicaJapanJordanKazakhstanKenyaKoreaKuwaitLaosLatin AmericaLatviaLebanonLiberiaLithuaniaMalaysiaMexicoMicronesiaMiddle AfricaMoldovaMoroccoNepalNetherlandsNicaraguaNigeriaNorth AmericaNorth MacedoniaNorthern AfricaNorthern EuropeNorwayOceaniaPakistanPanamaPeruPhilippinesPolandPortugalRomaniaRussiaSaudi ArabiaScotlandSenegalSerbiaSierra LeoneSingaporeSomaliaSouth AfricaSouth AmericaSouth Central AsiaSouth Eastern AsiaSouthern EuropeSpainSri LankaSt. Vincent and the GrenadinesSudanSwedenSwitzerlandSyriaTaiwanThailandTrinidad and TobagoTurkeyUgandaUkraineUruguayUzbekistanVenezuelaVietnamWest IndiesWestern AfricaWestern AsiaWestern EuropeYemenZaireZimbabweAzores
Seminole
Race
Ancestry
AfghanAfricanAlaska NativeAlaskan AthabascanAlbanianAleutAlsatianAmericanApacheArabArapahoArgentineanArmenianAssyrian/Chaldean/SyriacAustralianAustrianBahamianBangladeshiBarbadianBasqueBelgianBelizeanBermudanBhutaneseBlackfeetBolivianBrazilianBritishBritish West IndianBulgarianBurmeseCajunCambodianCanadianCape VerdeanCarpatho RusynCelticCentral AmericanCentral American IndianCherokeeCheyenneChickasawChileanChineseChippewaChoctawColombianColvilleComancheCosta RicanCreeCreekCroatianCrowCubanCypriotCzechCzechoslovakianDanishDelawareDominicanDutchDutch West IndianEastern EuropeanEcuadorianEgyptianEnglishEstonianEthiopianEuropeanFijianFilipinoFinnishFrenchFrench American IndianFrench CanadianGermanGerman RussianGhanaianGreekGuamanian/ChamorroGuatemalanGuyaneseHaitianHmongHonduranHopiHoumaHungarianIcelanderIndian (Asian)IndonesianInupiatIranianIraqiIrishIroquoisIsraeliItalianJamaicanJapaneseJordanianKenyanKiowaKoreanLaotianLatvianLebaneseLiberianLithuanianLumbeeLuxembourgerMacedonianMalaysianMalteseMarshalleseMenomineeMexicanMexican American IndianMongolianMoroccanNative HawaiianNavajoNepaleseNew ZealanderNicaraguanNigerianNorthern EuropeanNorwegianOkinawanOsageOttawaPaiutePakistaniPalestinianPanamanianParaguayanPennsylvania GermanPeruvianPimaPolishPortuguesePotawatomiPuebloPuerto RicanPuget Sound SalishRomanianRussianSalvadoranSamoanScandinavianScotch-IrishScottishSeminoleSenegaleseSerbianShoshoneSierra LeoneanSiouxSlavicSlovakSloveneSomaliSouth AfricanSouth AmericanSouth American IndianSoviet UnionSpaniardSpanishSpanish AmericanSpanish American IndianSri LankanSubsaharan AfricanSudaneseSwedishSwissSyrianTaiwaneseThaiTlingit-HaidaTohono O'OdhamTonganTrinidadian and TobagonianTsimshianTurkishU.S. Virgin IslanderUgandanUkrainianUruguayanUteVenezuelanVietnameseWelshWest IndianYakamaYaquiYugoslavianYumanYup'ikZimbabwean
Immigration
NonimmigrantsImmigrantsAfghanistanAfricaAlbaniaArgentinaArmeniaAsiaAustraliaAustriaBahamasBangladeshBarbadosBelarusBelgiumBelizeBoliviaBosnia and HerzegovinaBrazilBulgariaBurma/MyanmarCabo VerdeCambodiaCameroonCanadaCaribbeanCentral AmericaChileChinaColombiaCongoCosta RicaCroatiaCubaCzechoslovakiaDenmarkDominicaDominican RepublicEastern AfricaEastern AsiaEcuadorEgyptEl SalvadorEnglandEritreaEthiopiaEuropeFijiFranceGermanyGhanaGreeceGrenadaGuatemalaGuyanaHaitiHondurasHong KongHungaryIndiaIndonesiaIranIraqIrelandIsraelItalyJamaicaJapanJordanKazakhstanKenyaKoreaKuwaitLaosLatin AmericaLatviaLebanonLiberiaLithuaniaMalaysiaMexicoMicronesiaMiddle AfricaMoldovaMoroccoNepalNetherlandsNicaraguaNigeriaNorth AmericaNorth MacedoniaNorthern AfricaNorthern EuropeNorwayOceaniaPakistanPanamaPeruPhilippinesPolandPortugalRomaniaRussiaSaudi ArabiaScotlandSenegalSerbiaSierra LeoneSingaporeSomaliaSouth AfricaSouth AmericaSouth Central AsiaSouth Eastern AsiaSouthern EuropeSpainSri LankaSt. Vincent and the GrenadinesSudanSwedenSwitzerlandSyriaTaiwanThailandTrinidad and TobagoTurkeyUgandaUkraineUruguayUzbekistanVenezuelaVietnamWest IndiesWestern AfricaWestern AsiaWestern EuropeYemenZaireZimbabweAzores
3rd Grade
Income
Poverty
Unemployment
Labor Participation
Family Structure
Vehicle Availability
Education Level
Disability

3rd Grade Comparison

Immigrants from Eastern Europe

Seminole

Good
Excellent
97.8%
3RD GRADE
64.1/ 100
METRIC RATING
154th/ 347
METRIC RANK
97.9%
3RD GRADE
88.7/ 100
METRIC RATING
134th/ 347
METRIC RANK

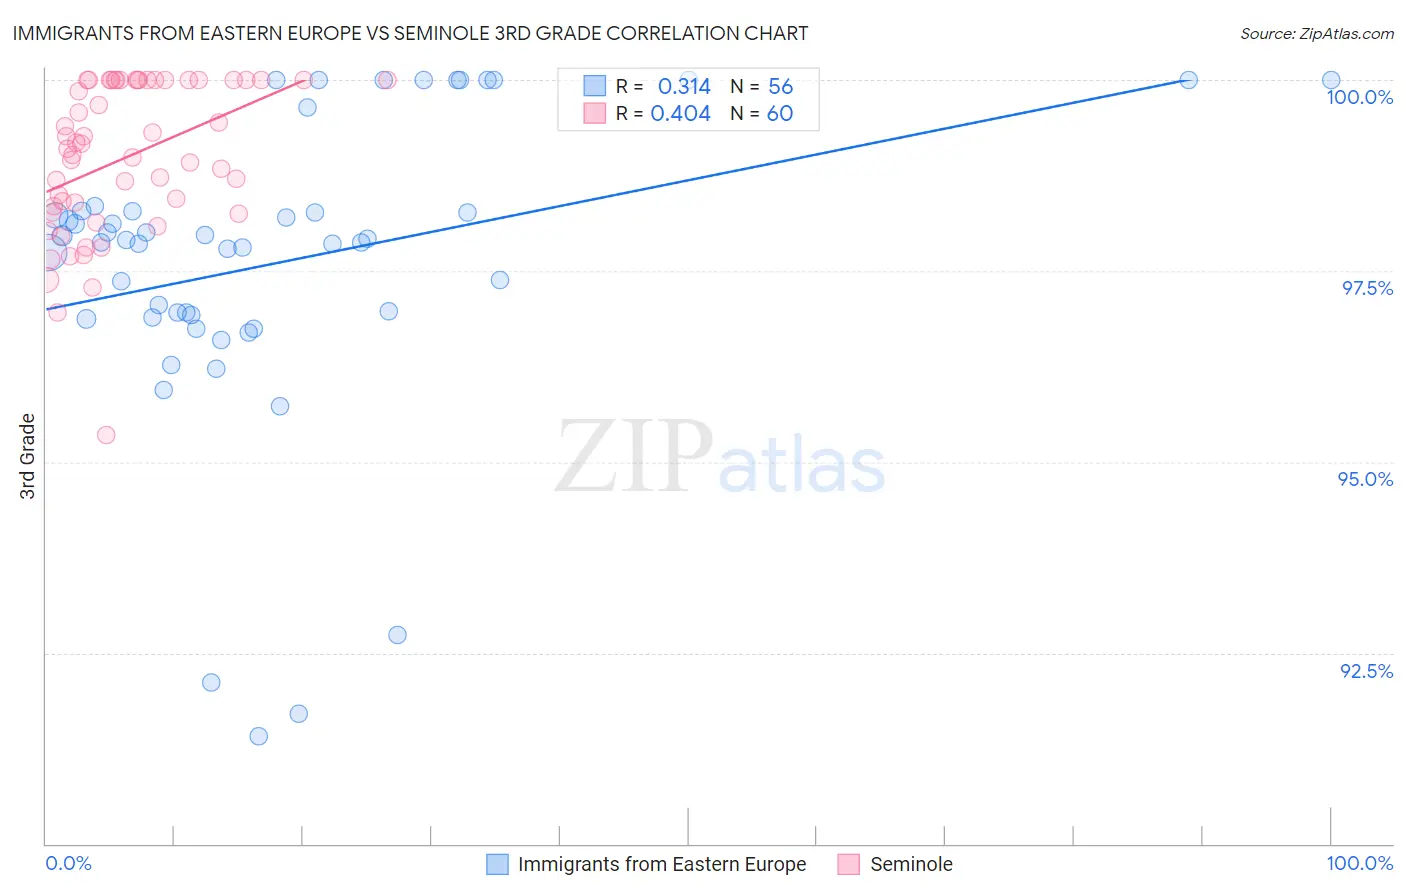
Immigrants from Eastern Europe vs Seminole 3rd Grade Correlation Chart

The statistical analysis conducted on geographies consisting of 475,879,420 people shows a mild positive correlation between the proportion of Immigrants from Eastern Europe and percentage of population with at least 3rd grade education in the United States with a correlation coefficient (R) of 0.314 and weighted average of 97.8%. Similarly, the statistical analysis conducted on geographies consisting of 118,313,258 people shows a moderate positive correlation between the proportion of Seminole and percentage of population with at least 3rd grade education in the United States with a correlation coefficient (R) of 0.404 and weighted average of 97.9%, a difference of 0.12%.
Immigrants from Eastern Europe vs Seminole 3rd Grade

3rd Grade Correlation Summary

MeasurementImmigrants from Eastern EuropeSeminole
Minimum91.4%95.3%
Maximum100.0%100.0%
Range8.6%4.7%
Mean97.6%99.0%
Median97.9%99.1%
Interquartile 25% (IQ1)96.9%98.3%
Interquartile 75% (IQ3)98.3%100.0%
Interquartile Range (IQR)1.4%1.7%
Standard Deviation (Sample)2.0%1.0%
Standard Deviation (Population)2.0%1.0%

Demographics Similar to Immigrants from Eastern Europe and Seminole by 3rd Grade

In terms of 3rd grade, the demographic groups most similar to Immigrants from Eastern Europe are Immigrants from South Central Asia (97.8%, a difference of 0.020%), Apache (97.8%, a difference of 0.020%), Soviet Union (97.8%, a difference of 0.030%), Immigrants from North Macedonia (97.8%, a difference of 0.040%), and Jordanian (97.8%, a difference of 0.040%). Similarly, the demographic groups most similar to Seminole are Cambodian (97.9%, a difference of 0.0%), Spaniard (97.9%, a difference of 0.010%), Immigrants from Romania (97.9%, a difference of 0.010%), Israeli (97.9%, a difference of 0.020%), and Blackfeet (97.9%, a difference of 0.020%).
DemographicsRating | Rank3rd Grade
Seminole
88.7
/100
|
#134
Excellent
97.9%
Cambodians
88.1
/100
|
#135
Excellent
97.9%
Spaniards
87.9
/100
|
#136
Excellent
97.9%
Immigrants | Romania
87.9
/100
|
#137
Excellent
97.9%
Israelis
86.6
/100
|
#138
Excellent
97.9%
Blackfeet
86.3
/100
|
#139
Excellent
97.9%
Palestinians
84.6
/100
|
#140
Excellent
97.9%
Immigrants | Turkey
83.5
/100
|
#141
Excellent
97.9%
Hmong
80.3
/100
|
#142
Excellent
97.9%
Filipinos
79.9
/100
|
#143
Good
97.9%
Burmese
79.6
/100
|
#144
Good
97.9%
Immigrants | Greece
79.5
/100
|
#145
Good
97.9%
Alsatians
78.3
/100
|
#146
Good
97.9%
Immigrants | Israel
77.3
/100
|
#147
Good
97.9%
Immigrants | Moldova
77.1
/100
|
#148
Good
97.9%
Immigrants | North Macedonia
74.5
/100
|
#149
Good
97.8%
Jordanians
74.5
/100
|
#150
Good
97.8%
Soviet Union
72.6
/100
|
#151
Good
97.8%
Immigrants | South Central Asia
69.5
/100
|
#152
Good
97.8%
Apache
68.5
/100
|
#153
Good
97.8%
Immigrants | Eastern Europe
64.1
/100
|
#154
Good
97.8%