Irish vs Seminole 3rd Grade
COMPARE
Irish
Seminole
3rd Grade
3rd Grade Comparison
Irish
Seminole
98.5%
3RD GRADE
100.0/ 100
METRIC RATING
18th/ 347
METRIC RANK
97.9%
3RD GRADE
88.7/ 100
METRIC RATING
134th/ 347
METRIC RANK
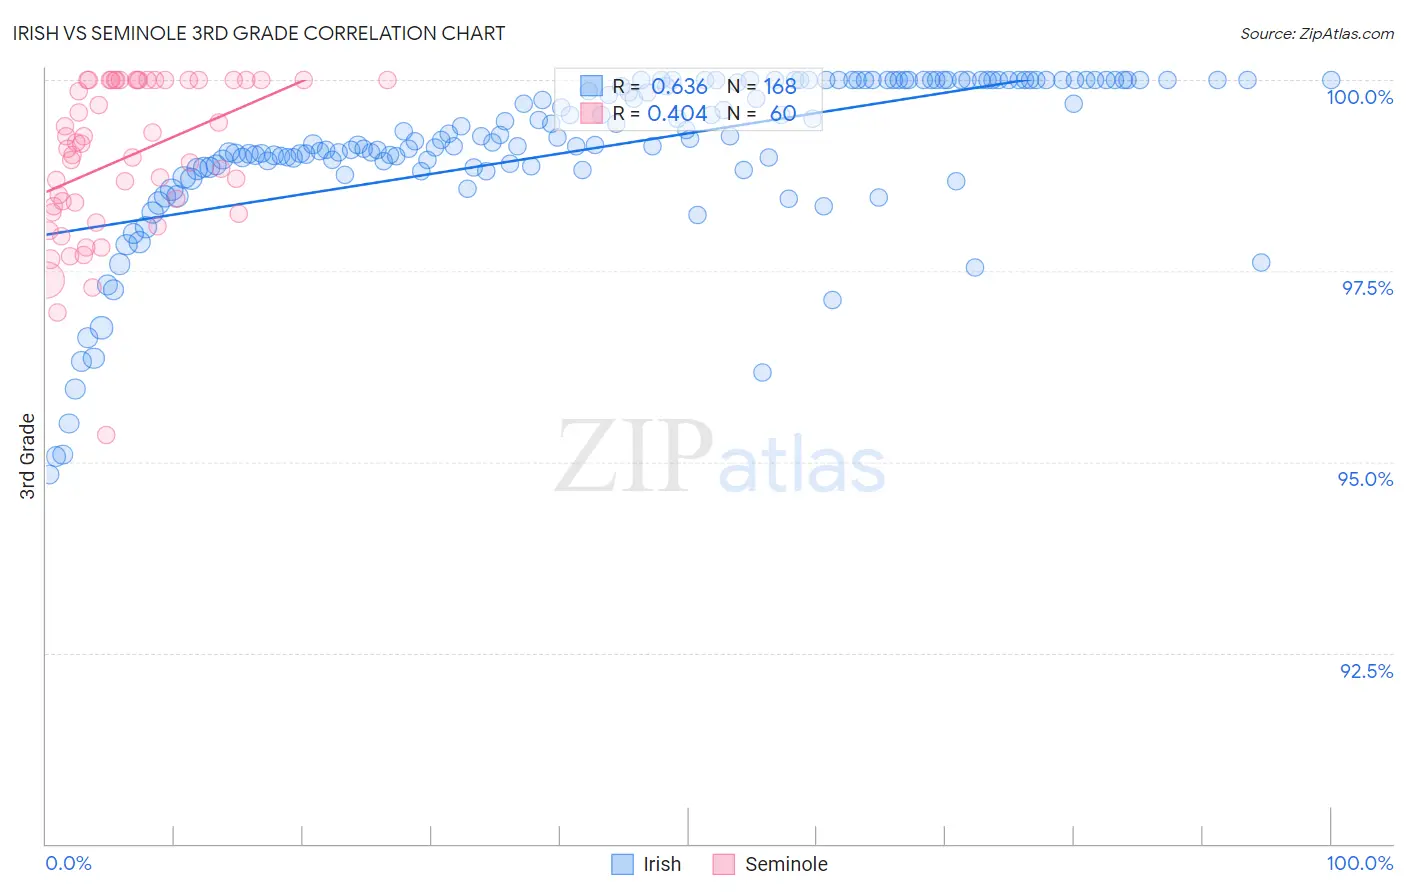
Irish vs Seminole 3rd Grade Correlation Chart
The statistical analysis conducted on geographies consisting of 580,708,963 people shows a significant positive correlation between the proportion of Irish and percentage of population with at least 3rd grade education in the United States with a correlation coefficient (R) of 0.636 and weighted average of 98.5%. Similarly, the statistical analysis conducted on geographies consisting of 118,313,258 people shows a moderate positive correlation between the proportion of Seminole and percentage of population with at least 3rd grade education in the United States with a correlation coefficient (R) of 0.404 and weighted average of 97.9%, a difference of 0.58%.
3rd Grade Correlation Summary
| Measurement | Irish | Seminole |
| Minimum | 94.8% | 95.3% |
| Maximum | 100.0% | 100.0% |
| Range | 5.2% | 4.7% |
| Mean | 99.1% | 99.0% |
| Median | 99.2% | 99.1% |
| Interquartile 25% (IQ1) | 98.9% | 98.3% |
| Interquartile 75% (IQ3) | 100.0% | 100.0% |
| Interquartile Range (IQR) | 1.1% | 1.7% |
| Standard Deviation (Sample) | 1.1% | 1.0% |
| Standard Deviation (Population) | 1.1% | 1.0% |
Similar Demographics by 3rd Grade
Demographics Similar to Irish by 3rd Grade
In terms of 3rd grade, the demographic groups most similar to Irish are Dutch (98.5%, a difference of 0.010%), Polish (98.5%, a difference of 0.010%), Pennsylvania German (98.5%, a difference of 0.010%), Lithuanian (98.5%, a difference of 0.010%), and Scottish (98.5%, a difference of 0.020%).
| Demographics | Rating | Rank | 3rd Grade |
| Slovenes | 100.0 /100 | #11 | Exceptional 98.6% |
| English | 100.0 /100 | #12 | Exceptional 98.6% |
| Tlingit-Haida | 100.0 /100 | #13 | Exceptional 98.5% |
| Carpatho Rusyns | 100.0 /100 | #14 | Exceptional 98.5% |
| Swedes | 100.0 /100 | #15 | Exceptional 98.5% |
| Scottish | 100.0 /100 | #16 | Exceptional 98.5% |
| Dutch | 100.0 /100 | #17 | Exceptional 98.5% |
| Irish | 100.0 /100 | #18 | Exceptional 98.5% |
| Poles | 100.0 /100 | #19 | Exceptional 98.5% |
| Pennsylvania Germans | 100.0 /100 | #20 | Exceptional 98.5% |
| Lithuanians | 100.0 /100 | #21 | Exceptional 98.5% |
| Finns | 100.0 /100 | #22 | Exceptional 98.5% |
| Sioux | 100.0 /100 | #23 | Exceptional 98.5% |
| Danes | 100.0 /100 | #24 | Exceptional 98.5% |
| Scotch-Irish | 100.0 /100 | #25 | Exceptional 98.5% |
Demographics Similar to Seminole by 3rd Grade
In terms of 3rd grade, the demographic groups most similar to Seminole are Immigrants from Bulgaria (97.9%, a difference of 0.0%), Immigrants from Hungary (97.9%, a difference of 0.0%), Immigrants from Kuwait (97.9%, a difference of 0.0%), Cambodian (97.9%, a difference of 0.0%), and Spaniard (97.9%, a difference of 0.010%).
| Demographics | Rating | Rank | 3rd Grade |
| Ute | 93.2 /100 | #127 | Exceptional 98.0% |
| Colville | 92.1 /100 | #128 | Exceptional 98.0% |
| Immigrants | Serbia | 91.9 /100 | #129 | Exceptional 98.0% |
| Immigrants | Europe | 91.2 /100 | #130 | Exceptional 98.0% |
| Immigrants | Bulgaria | 89.1 /100 | #131 | Excellent 97.9% |
| Immigrants | Hungary | 88.8 /100 | #132 | Excellent 97.9% |
| Immigrants | Kuwait | 88.7 /100 | #133 | Excellent 97.9% |
| Seminole | 88.7 /100 | #134 | Excellent 97.9% |
| Cambodians | 88.1 /100 | #135 | Excellent 97.9% |
| Spaniards | 87.9 /100 | #136 | Excellent 97.9% |
| Immigrants | Romania | 87.9 /100 | #137 | Excellent 97.9% |
| Israelis | 86.6 /100 | #138 | Excellent 97.9% |
| Blackfeet | 86.3 /100 | #139 | Excellent 97.9% |
| Palestinians | 84.6 /100 | #140 | Excellent 97.9% |
| Immigrants | Turkey | 83.5 /100 | #141 | Excellent 97.9% |