Immigrants from Eastern Europe vs Immigrants 3rd Grade
COMPARE
Immigrants from Eastern Europe
Immigrants
3rd Grade
3rd Grade Comparison
Immigrants from Eastern Europe
Immigrants
97.8%
3RD GRADE
64.1/ 100
METRIC RATING
154th/ 347
METRIC RANK
96.9%
3RD GRADE
0.0/ 100
METRIC RATING
296th/ 347
METRIC RANK
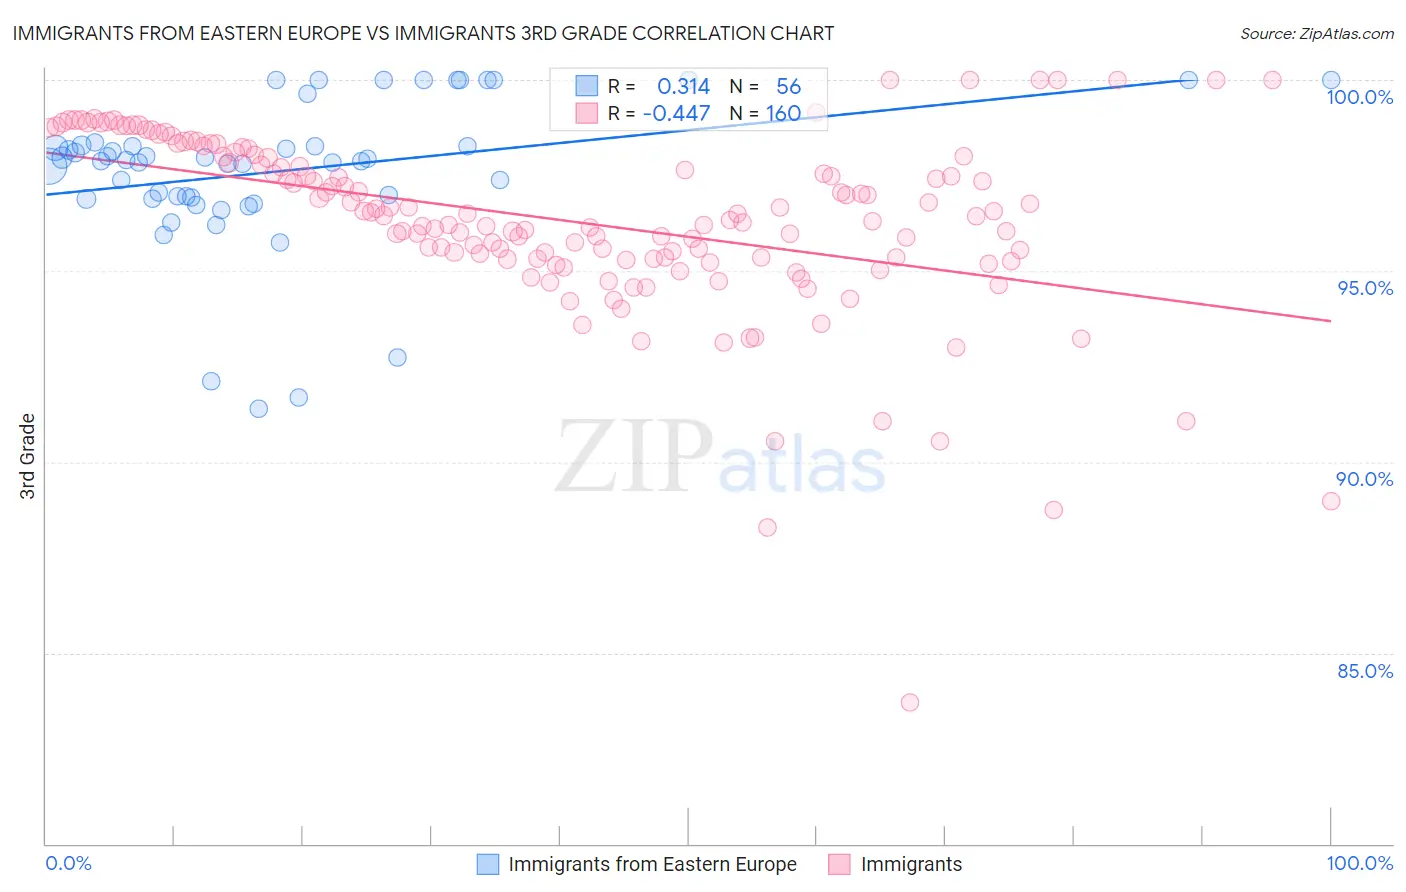
Immigrants from Eastern Europe vs Immigrants 3rd Grade Correlation Chart
The statistical analysis conducted on geographies consisting of 475,879,420 people shows a mild positive correlation between the proportion of Immigrants from Eastern Europe and percentage of population with at least 3rd grade education in the United States with a correlation coefficient (R) of 0.314 and weighted average of 97.8%. Similarly, the statistical analysis conducted on geographies consisting of 577,788,049 people shows a moderate negative correlation between the proportion of Immigrants and percentage of population with at least 3rd grade education in the United States with a correlation coefficient (R) of -0.447 and weighted average of 96.9%, a difference of 0.96%.
3rd Grade Correlation Summary
| Measurement | Immigrants from Eastern Europe | Immigrants |
| Minimum | 91.4% | 83.7% |
| Maximum | 100.0% | 100.0% |
| Range | 8.6% | 16.3% |
| Mean | 97.6% | 96.3% |
| Median | 97.9% | 96.4% |
| Interquartile 25% (IQ1) | 96.9% | 95.3% |
| Interquartile 75% (IQ3) | 98.3% | 98.0% |
| Interquartile Range (IQR) | 1.4% | 2.7% |
| Standard Deviation (Sample) | 2.0% | 2.4% |
| Standard Deviation (Population) | 2.0% | 2.4% |
Similar Demographics by 3rd Grade
Demographics Similar to Immigrants from Eastern Europe by 3rd Grade
In terms of 3rd grade, the demographic groups most similar to Immigrants from Eastern Europe are Bermudan (97.8%, a difference of 0.010%), Immigrants from Russia (97.8%, a difference of 0.010%), Immigrants from Italy (97.8%, a difference of 0.010%), Venezuelan (97.8%, a difference of 0.010%), and French American Indian (97.8%, a difference of 0.010%).
| Demographics | Rating | Rank | 3rd Grade |
| Immigrants | Israel | 77.3 /100 | #147 | Good 97.9% |
| Immigrants | Moldova | 77.1 /100 | #148 | Good 97.9% |
| Immigrants | North Macedonia | 74.5 /100 | #149 | Good 97.8% |
| Jordanians | 74.5 /100 | #150 | Good 97.8% |
| Soviet Union | 72.6 /100 | #151 | Good 97.8% |
| Immigrants | South Central Asia | 69.5 /100 | #152 | Good 97.8% |
| Apache | 68.5 /100 | #153 | Good 97.8% |
| Immigrants | Eastern Europe | 64.1 /100 | #154 | Good 97.8% |
| Bermudans | 62.6 /100 | #155 | Good 97.8% |
| Immigrants | Russia | 61.7 /100 | #156 | Good 97.8% |
| Immigrants | Italy | 61.2 /100 | #157 | Good 97.8% |
| Venezuelans | 60.9 /100 | #158 | Good 97.8% |
| French American Indians | 60.0 /100 | #159 | Average 97.8% |
| Immigrants | Iran | 59.1 /100 | #160 | Average 97.8% |
| Albanians | 58.8 /100 | #161 | Average 97.8% |
Demographics Similar to Immigrants by 3rd Grade
In terms of 3rd grade, the demographic groups most similar to Immigrants are Haitian (96.9%, a difference of 0.020%), Immigrants from Dominica (96.9%, a difference of 0.030%), Somali (96.8%, a difference of 0.040%), Immigrants from South Eastern Asia (96.8%, a difference of 0.050%), and Immigrants from Cuba (96.8%, a difference of 0.050%).
| Demographics | Rating | Rank | 3rd Grade |
| Immigrants | Thailand | 0.0 /100 | #289 | Tragic 97.1% |
| Immigrants | Portugal | 0.0 /100 | #290 | Tragic 97.0% |
| Immigrants | Afghanistan | 0.0 /100 | #291 | Tragic 97.0% |
| British West Indians | 0.0 /100 | #292 | Tragic 97.0% |
| Immigrants | Grenada | 0.0 /100 | #293 | Tragic 97.0% |
| Malaysians | 0.0 /100 | #294 | Tragic 97.0% |
| Immigrants | Eritrea | 0.0 /100 | #295 | Tragic 97.0% |
| Immigrants | Immigrants | 0.0 /100 | #296 | Tragic 96.9% |
| Haitians | 0.0 /100 | #297 | Tragic 96.9% |
| Immigrants | Dominica | 0.0 /100 | #298 | Tragic 96.9% |
| Somalis | 0.0 /100 | #299 | Tragic 96.8% |
| Immigrants | South Eastern Asia | 0.0 /100 | #300 | Tragic 96.8% |
| Immigrants | Cuba | 0.0 /100 | #301 | Tragic 96.8% |
| Immigrants | Somalia | 0.0 /100 | #302 | Tragic 96.8% |
| Ecuadorians | 0.0 /100 | #303 | Tragic 96.7% |