Immigrants from Colombia vs Norwegian 9th Grade
COMPARE
Immigrants from Colombia
Norwegian
9th Grade
9th Grade Comparison
Immigrants from Colombia
Norwegians
93.8%
9TH GRADE
0.2/ 100
METRIC RATING
275th/ 347
METRIC RANK
96.9%
9TH GRADE
100.0/ 100
METRIC RATING
2nd/ 347
METRIC RANK
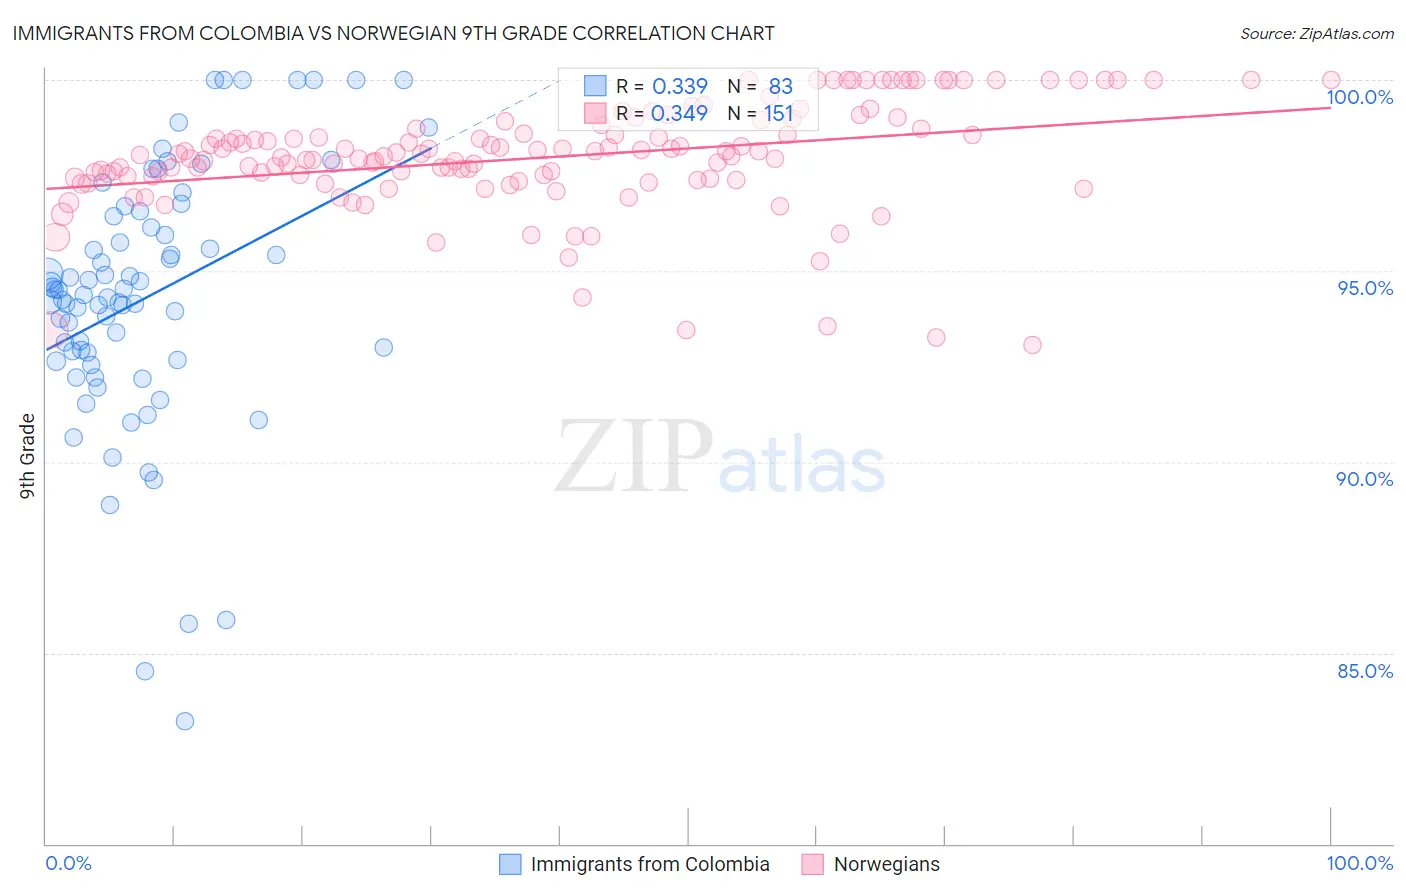
Immigrants from Colombia vs Norwegian 9th Grade Correlation Chart
The statistical analysis conducted on geographies consisting of 378,643,826 people shows a mild positive correlation between the proportion of Immigrants from Colombia and percentage of population with at least 9th grade education in the United States with a correlation coefficient (R) of 0.339 and weighted average of 93.8%. Similarly, the statistical analysis conducted on geographies consisting of 533,395,166 people shows a mild positive correlation between the proportion of Norwegians and percentage of population with at least 9th grade education in the United States with a correlation coefficient (R) of 0.349 and weighted average of 96.9%, a difference of 3.4%.
9th Grade Correlation Summary
| Measurement | Immigrants from Colombia | Norwegian |
| Minimum | 83.2% | 93.1% |
| Maximum | 100.0% | 100.0% |
| Range | 16.8% | 6.9% |
| Mean | 94.3% | 98.0% |
| Median | 94.4% | 98.0% |
| Interquartile 25% (IQ1) | 92.7% | 97.4% |
| Interquartile 75% (IQ3) | 96.4% | 98.7% |
| Interquartile Range (IQR) | 3.7% | 1.3% |
| Standard Deviation (Sample) | 3.4% | 1.4% |
| Standard Deviation (Population) | 3.4% | 1.4% |
Similar Demographics by 9th Grade
Demographics Similar to Immigrants from Colombia by 9th Grade
In terms of 9th grade, the demographic groups most similar to Immigrants from Colombia are Immigrants from South America (93.8%, a difference of 0.010%), Peruvian (93.8%, a difference of 0.010%), Immigrants from Western Africa (93.8%, a difference of 0.020%), West Indian (93.7%, a difference of 0.020%), and Immigrants from Philippines (93.7%, a difference of 0.020%).
| Demographics | Rating | Rank | 9th Grade |
| Immigrants | Bolivia | 0.3 /100 | #268 | Tragic 93.9% |
| Immigrants | Uruguay | 0.2 /100 | #269 | Tragic 93.8% |
| Yuman | 0.2 /100 | #270 | Tragic 93.8% |
| Immigrants | Ghana | 0.2 /100 | #271 | Tragic 93.8% |
| Immigrants | Western Africa | 0.2 /100 | #272 | Tragic 93.8% |
| Immigrants | South America | 0.2 /100 | #273 | Tragic 93.8% |
| Peruvians | 0.2 /100 | #274 | Tragic 93.8% |
| Immigrants | Colombia | 0.2 /100 | #275 | Tragic 93.8% |
| West Indians | 0.2 /100 | #276 | Tragic 93.7% |
| Immigrants | Philippines | 0.1 /100 | #277 | Tragic 93.7% |
| Immigrants | Eritrea | 0.1 /100 | #278 | Tragic 93.7% |
| Trinidadians and Tobagonians | 0.1 /100 | #279 | Tragic 93.7% |
| Taiwanese | 0.1 /100 | #280 | Tragic 93.6% |
| Immigrants | Trinidad and Tobago | 0.1 /100 | #281 | Tragic 93.6% |
| Malaysians | 0.0 /100 | #282 | Tragic 93.5% |
Demographics Similar to Norwegians by 9th Grade
In terms of 9th grade, the demographic groups most similar to Norwegians are Slovak (96.9%, a difference of 0.050%), Tsimshian (97.0%, a difference of 0.090%), Slovene (96.7%, a difference of 0.18%), Swedish (96.7%, a difference of 0.18%), and Polish (96.7%, a difference of 0.19%).
| Demographics | Rating | Rank | 9th Grade |
| Tsimshian | 100.0 /100 | #1 | Exceptional 97.0% |
| Norwegians | 100.0 /100 | #2 | Exceptional 96.9% |
| Slovaks | 100.0 /100 | #3 | Exceptional 96.9% |
| Slovenes | 100.0 /100 | #4 | Exceptional 96.7% |
| Swedes | 100.0 /100 | #5 | Exceptional 96.7% |
| Poles | 100.0 /100 | #6 | Exceptional 96.7% |
| Carpatho Rusyns | 100.0 /100 | #7 | Exceptional 96.7% |
| Germans | 100.0 /100 | #8 | Exceptional 96.7% |
| Tlingit-Haida | 100.0 /100 | #9 | Exceptional 96.6% |
| Lithuanians | 100.0 /100 | #10 | Exceptional 96.6% |
| Finns | 100.0 /100 | #11 | Exceptional 96.6% |
| English | 100.0 /100 | #12 | Exceptional 96.6% |
| Danes | 100.0 /100 | #13 | Exceptional 96.5% |
| Scottish | 100.0 /100 | #14 | Exceptional 96.5% |
| Irish | 100.0 /100 | #15 | Exceptional 96.5% |