Immigrants from Albania vs Luxembourger 3rd Grade
COMPARE
Immigrants from Albania
Luxembourger
3rd Grade
3rd Grade Comparison
Immigrants from Albania
Luxembourgers
97.7%
3RD GRADE
22.6/ 100
METRIC RATING
200th/ 347
METRIC RANK
98.3%
3RD GRADE
99.9/ 100
METRIC RATING
41st/ 347
METRIC RANK
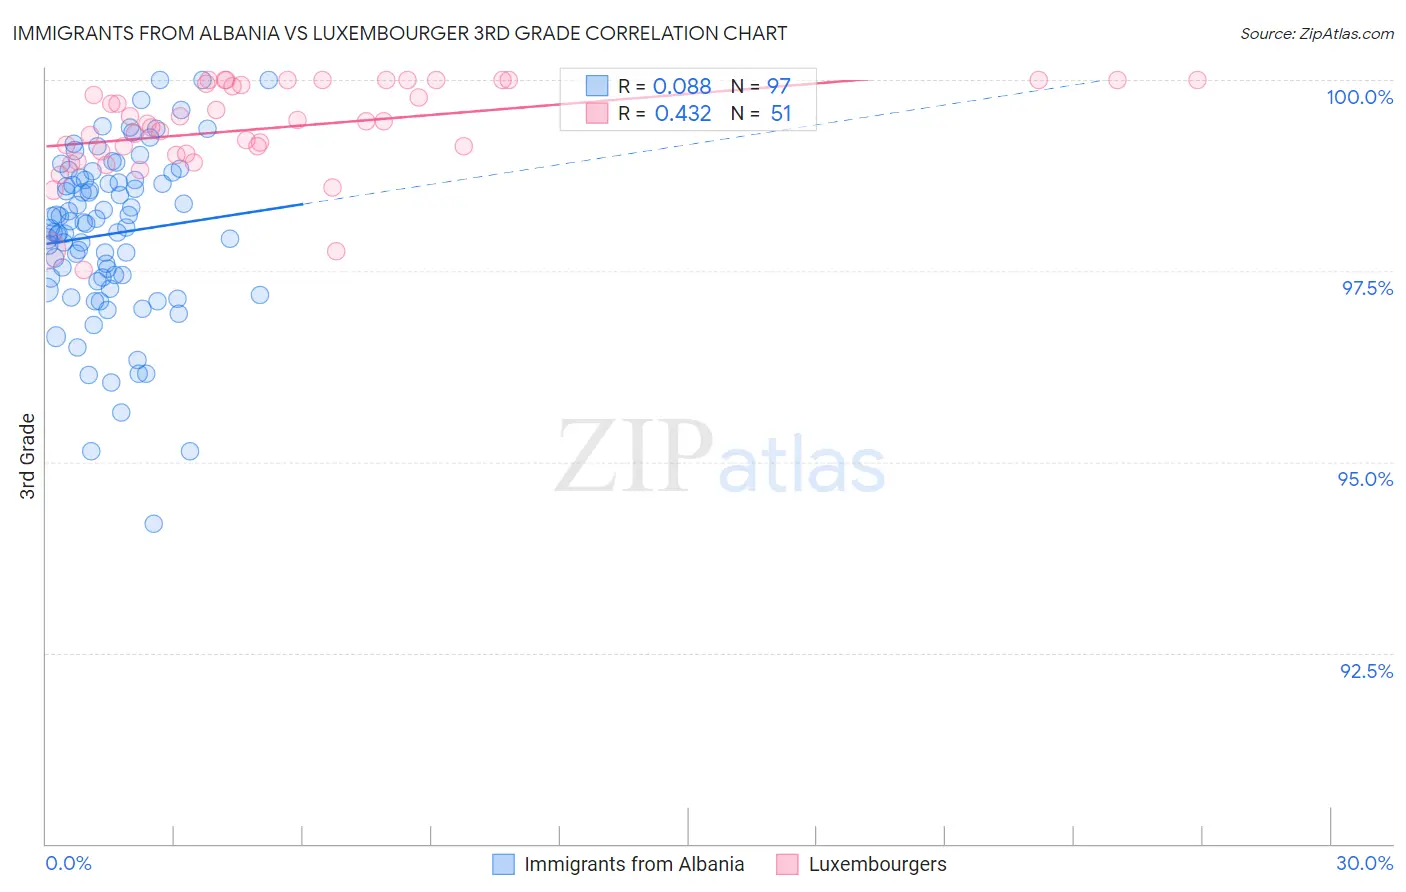
Immigrants from Albania vs Luxembourger 3rd Grade Correlation Chart
The statistical analysis conducted on geographies consisting of 119,265,453 people shows a slight positive correlation between the proportion of Immigrants from Albania and percentage of population with at least 3rd grade education in the United States with a correlation coefficient (R) of 0.088 and weighted average of 97.7%. Similarly, the statistical analysis conducted on geographies consisting of 144,675,804 people shows a moderate positive correlation between the proportion of Luxembourgers and percentage of population with at least 3rd grade education in the United States with a correlation coefficient (R) of 0.432 and weighted average of 98.3%, a difference of 0.70%.
3rd Grade Correlation Summary
| Measurement | Immigrants from Albania | Luxembourger |
| Minimum | 94.2% | 97.5% |
| Maximum | 100.0% | 100.0% |
| Range | 5.8% | 2.5% |
| Mean | 98.0% | 99.4% |
| Median | 98.1% | 99.5% |
| Interquartile 25% (IQ1) | 97.4% | 99.0% |
| Interquartile 75% (IQ3) | 98.7% | 100.0% |
| Interquartile Range (IQR) | 1.3% | 0.96% |
| Standard Deviation (Sample) | 1.1% | 0.61% |
| Standard Deviation (Population) | 1.1% | 0.61% |
Similar Demographics by 3rd Grade
Demographics Similar to Immigrants from Albania by 3rd Grade
In terms of 3rd grade, the demographic groups most similar to Immigrants from Albania are Immigrants from Ukraine (97.7%, a difference of 0.0%), Immigrants from Lebanon (97.7%, a difference of 0.0%), Hawaiian (97.7%, a difference of 0.010%), Guamanian/Chamorro (97.7%, a difference of 0.010%), and Immigrants from Uganda (97.7%, a difference of 0.020%).
| Demographics | Rating | Rank | 3rd Grade |
| Immigrants | Kenya | 28.2 /100 | #193 | Fair 97.7% |
| Immigrants | Uganda | 27.4 /100 | #194 | Fair 97.7% |
| Immigrants | Egypt | 26.8 /100 | #195 | Fair 97.7% |
| Paraguayans | 26.2 /100 | #196 | Fair 97.7% |
| Hawaiians | 25.7 /100 | #197 | Fair 97.7% |
| Guamanians/Chamorros | 23.6 /100 | #198 | Fair 97.7% |
| Immigrants | Ukraine | 22.7 /100 | #199 | Fair 97.7% |
| Immigrants | Albania | 22.6 /100 | #200 | Fair 97.7% |
| Immigrants | Lebanon | 21.7 /100 | #201 | Fair 97.7% |
| Immigrants | Southern Europe | 17.7 /100 | #202 | Poor 97.6% |
| Paiute | 16.7 /100 | #203 | Poor 97.6% |
| Immigrants | Chile | 16.5 /100 | #204 | Poor 97.6% |
| Africans | 14.5 /100 | #205 | Poor 97.6% |
| Immigrants | Northern Africa | 13.0 /100 | #206 | Poor 97.6% |
| Tohono O'odham | 12.5 /100 | #207 | Poor 97.6% |
Demographics Similar to Luxembourgers by 3rd Grade
In terms of 3rd grade, the demographic groups most similar to Luxembourgers are Belgian (98.3%, a difference of 0.0%), Eastern European (98.3%, a difference of 0.010%), Northern European (98.3%, a difference of 0.010%), Latvian (98.4%, a difference of 0.020%), and Hungarian (98.3%, a difference of 0.020%).
| Demographics | Rating | Rank | 3rd Grade |
| Swiss | 100.0 /100 | #34 | Exceptional 98.4% |
| Arapaho | 100.0 /100 | #35 | Exceptional 98.4% |
| British | 99.9 /100 | #36 | Exceptional 98.4% |
| Italians | 99.9 /100 | #37 | Exceptional 98.4% |
| Chippewa | 99.9 /100 | #38 | Exceptional 98.4% |
| Latvians | 99.9 /100 | #39 | Exceptional 98.4% |
| Eastern Europeans | 99.9 /100 | #40 | Exceptional 98.3% |
| Luxembourgers | 99.9 /100 | #41 | Exceptional 98.3% |
| Belgians | 99.9 /100 | #42 | Exceptional 98.3% |
| Northern Europeans | 99.9 /100 | #43 | Exceptional 98.3% |
| Hungarians | 99.9 /100 | #44 | Exceptional 98.3% |
| Native Hawaiians | 99.9 /100 | #45 | Exceptional 98.3% |
| Ottawa | 99.8 /100 | #46 | Exceptional 98.3% |
| Czechoslovakians | 99.8 /100 | #47 | Exceptional 98.3% |
| Lumbee | 99.8 /100 | #48 | Exceptional 98.3% |