Marshallese vs Luxembourger 3rd Grade
COMPARE
Marshallese
Luxembourger
3rd Grade
3rd Grade Comparison
Marshallese
Luxembourgers
97.8%
3RD GRADE
57.2/ 100
METRIC RATING
163rd/ 347
METRIC RANK
98.3%
3RD GRADE
99.9/ 100
METRIC RATING
41st/ 347
METRIC RANK
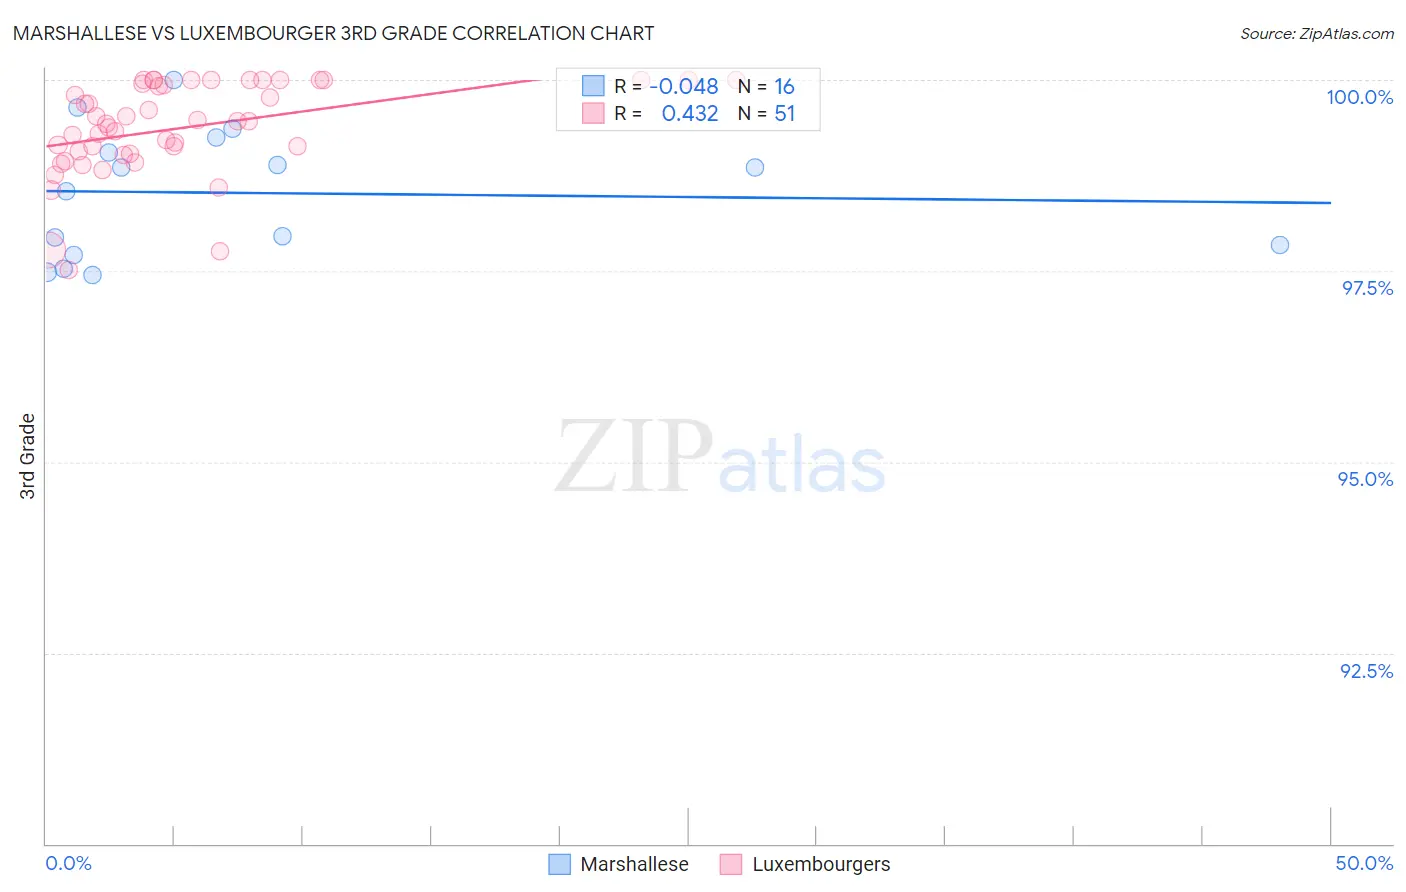
Marshallese vs Luxembourger 3rd Grade Correlation Chart
The statistical analysis conducted on geographies consisting of 14,761,315 people shows no correlation between the proportion of Marshallese and percentage of population with at least 3rd grade education in the United States with a correlation coefficient (R) of -0.048 and weighted average of 97.8%. Similarly, the statistical analysis conducted on geographies consisting of 144,675,804 people shows a moderate positive correlation between the proportion of Luxembourgers and percentage of population with at least 3rd grade education in the United States with a correlation coefficient (R) of 0.432 and weighted average of 98.3%, a difference of 0.57%.
3rd Grade Correlation Summary
| Measurement | Marshallese | Luxembourger |
| Minimum | 97.4% | 97.5% |
| Maximum | 100.0% | 100.0% |
| Range | 2.6% | 2.5% |
| Mean | 98.5% | 99.4% |
| Median | 98.7% | 99.5% |
| Interquartile 25% (IQ1) | 97.8% | 99.0% |
| Interquartile 75% (IQ3) | 99.1% | 100.0% |
| Interquartile Range (IQR) | 1.4% | 0.96% |
| Standard Deviation (Sample) | 0.83% | 0.61% |
| Standard Deviation (Population) | 0.80% | 0.61% |
Similar Demographics by 3rd Grade
Demographics Similar to Marshallese by 3rd Grade
In terms of 3rd grade, the demographic groups most similar to Marshallese are Immigrants from Jordan (97.8%, a difference of 0.0%), Immigrants from Bosnia and Herzegovina (97.8%, a difference of 0.0%), Ugandan (97.8%, a difference of 0.0%), Immigrants from Italy (97.8%, a difference of 0.010%), and Venezuelan (97.8%, a difference of 0.010%).
| Demographics | Rating | Rank | 3rd Grade |
| Immigrants | Russia | 61.7 /100 | #156 | Good 97.8% |
| Immigrants | Italy | 61.2 /100 | #157 | Good 97.8% |
| Venezuelans | 60.9 /100 | #158 | Good 97.8% |
| French American Indians | 60.0 /100 | #159 | Average 97.8% |
| Immigrants | Iran | 59.1 /100 | #160 | Average 97.8% |
| Albanians | 58.8 /100 | #161 | Average 97.8% |
| Immigrants | Jordan | 57.9 /100 | #162 | Average 97.8% |
| Marshallese | 57.2 /100 | #163 | Average 97.8% |
| Immigrants | Bosnia and Herzegovina | 56.2 /100 | #164 | Average 97.8% |
| Ugandans | 56.1 /100 | #165 | Average 97.8% |
| Dutch West Indians | 55.5 /100 | #166 | Average 97.8% |
| Chileans | 55.3 /100 | #167 | Average 97.8% |
| Immigrants | Spain | 54.3 /100 | #168 | Average 97.8% |
| Comanche | 53.8 /100 | #169 | Average 97.8% |
| Brazilians | 53.7 /100 | #170 | Average 97.8% |
Demographics Similar to Luxembourgers by 3rd Grade
In terms of 3rd grade, the demographic groups most similar to Luxembourgers are Belgian (98.3%, a difference of 0.0%), Eastern European (98.3%, a difference of 0.010%), Northern European (98.3%, a difference of 0.010%), Latvian (98.4%, a difference of 0.020%), and Hungarian (98.3%, a difference of 0.020%).
| Demographics | Rating | Rank | 3rd Grade |
| Swiss | 100.0 /100 | #34 | Exceptional 98.4% |
| Arapaho | 100.0 /100 | #35 | Exceptional 98.4% |
| British | 99.9 /100 | #36 | Exceptional 98.4% |
| Italians | 99.9 /100 | #37 | Exceptional 98.4% |
| Chippewa | 99.9 /100 | #38 | Exceptional 98.4% |
| Latvians | 99.9 /100 | #39 | Exceptional 98.4% |
| Eastern Europeans | 99.9 /100 | #40 | Exceptional 98.3% |
| Luxembourgers | 99.9 /100 | #41 | Exceptional 98.3% |
| Belgians | 99.9 /100 | #42 | Exceptional 98.3% |
| Northern Europeans | 99.9 /100 | #43 | Exceptional 98.3% |
| Hungarians | 99.9 /100 | #44 | Exceptional 98.3% |
| Native Hawaiians | 99.9 /100 | #45 | Exceptional 98.3% |
| Ottawa | 99.8 /100 | #46 | Exceptional 98.3% |
| Czechoslovakians | 99.8 /100 | #47 | Exceptional 98.3% |
| Lumbee | 99.8 /100 | #48 | Exceptional 98.3% |