Immigrants from Eastern Asia vs Hmong Kindergarten
COMPARE
Immigrants from Eastern Asia
Hmong
Kindergarten
Kindergarten Comparison
Immigrants from Eastern Asia
Hmong
97.6%
KINDERGARTEN
1.7/ 100
METRIC RATING
238th/ 347
METRIC RANK
98.1%
KINDERGARTEN
78.8/ 100
METRIC RATING
145th/ 347
METRIC RANK
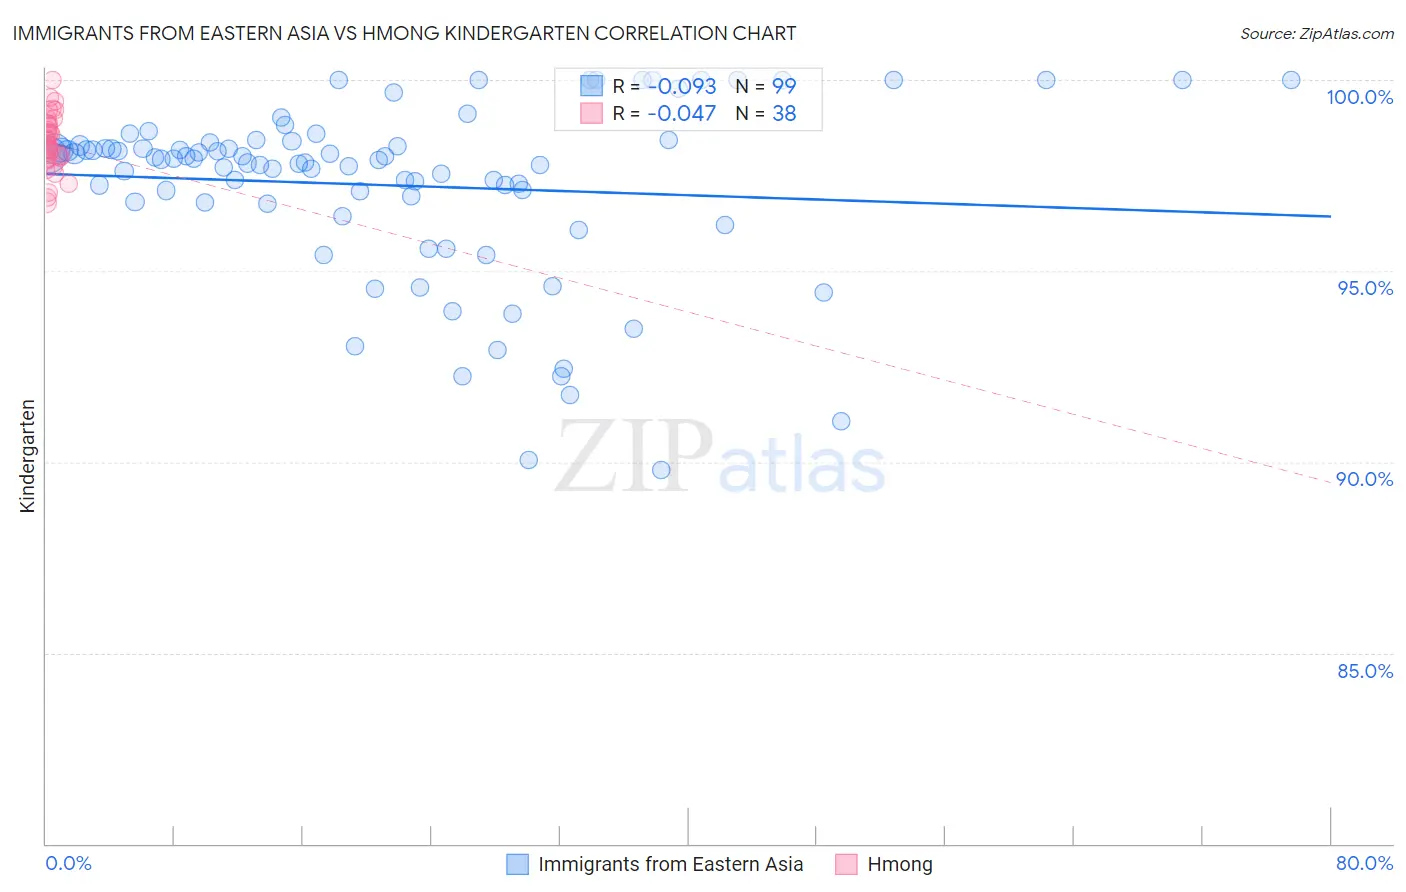
Immigrants from Eastern Asia vs Hmong Kindergarten Correlation Chart
The statistical analysis conducted on geographies consisting of 499,865,893 people shows a slight negative correlation between the proportion of Immigrants from Eastern Asia and percentage of population with at least kindergarten education in the United States with a correlation coefficient (R) of -0.093 and weighted average of 97.6%. Similarly, the statistical analysis conducted on geographies consisting of 24,672,093 people shows no correlation between the proportion of Hmong and percentage of population with at least kindergarten education in the United States with a correlation coefficient (R) of -0.047 and weighted average of 98.1%, a difference of 0.41%.
Kindergarten Correlation Summary
| Measurement | Immigrants from Eastern Asia | Hmong |
| Minimum | 89.8% | 96.8% |
| Maximum | 100.0% | 100.0% |
| Range | 10.2% | 3.2% |
| Mean | 97.2% | 98.4% |
| Median | 97.9% | 98.3% |
| Interquartile 25% (IQ1) | 96.8% | 98.0% |
| Interquartile 75% (IQ3) | 98.4% | 98.9% |
| Interquartile Range (IQR) | 1.6% | 0.90% |
| Standard Deviation (Sample) | 2.3% | 0.73% |
| Standard Deviation (Population) | 2.3% | 0.72% |
Similar Demographics by Kindergarten
Demographics Similar to Immigrants from Eastern Asia by Kindergarten
In terms of kindergarten, the demographic groups most similar to Immigrants from Eastern Asia are Nigerian (97.6%, a difference of 0.0%), U.S. Virgin Islander (97.6%, a difference of 0.0%), Korean (97.6%, a difference of 0.010%), Immigrants from Pakistan (97.7%, a difference of 0.020%), and Immigrants from Malaysia (97.7%, a difference of 0.020%).
| Demographics | Rating | Rank | Kindergarten |
| Puerto Ricans | 2.7 /100 | #231 | Tragic 97.7% |
| Immigrants | Uruguay | 2.6 /100 | #232 | Tragic 97.7% |
| Immigrants | Pakistan | 2.2 /100 | #233 | Tragic 97.7% |
| Immigrants | Malaysia | 2.2 /100 | #234 | Tragic 97.7% |
| Colombians | 2.2 /100 | #235 | Tragic 97.7% |
| Immigrants | Western Asia | 2.1 /100 | #236 | Tragic 97.7% |
| Nigerians | 1.8 /100 | #237 | Tragic 97.6% |
| Immigrants | Eastern Asia | 1.7 /100 | #238 | Tragic 97.6% |
| U.S. Virgin Islanders | 1.7 /100 | #239 | Tragic 97.6% |
| Koreans | 1.6 /100 | #240 | Tragic 97.6% |
| Liberians | 1.3 /100 | #241 | Tragic 97.6% |
| Immigrants | Indonesia | 1.3 /100 | #242 | Tragic 97.6% |
| Asians | 1.2 /100 | #243 | Tragic 97.6% |
| Bolivians | 1.2 /100 | #244 | Tragic 97.6% |
| South Americans | 1.1 /100 | #245 | Tragic 97.6% |
Demographics Similar to Hmong by Kindergarten
In terms of kindergarten, the demographic groups most similar to Hmong are Filipino (98.0%, a difference of 0.0%), Burmese (98.1%, a difference of 0.010%), Alsatian (98.1%, a difference of 0.010%), Immigrants from Israel (98.0%, a difference of 0.010%), and Palestinian (98.1%, a difference of 0.020%).
| Demographics | Rating | Rank | Kindergarten |
| Immigrants | Romania | 87.7 /100 | #138 | Excellent 98.1% |
| Israelis | 87.7 /100 | #139 | Excellent 98.1% |
| Palestinians | 83.6 /100 | #140 | Excellent 98.1% |
| Marshallese | 83.0 /100 | #141 | Excellent 98.1% |
| Immigrants | Turkey | 82.8 /100 | #142 | Excellent 98.1% |
| Burmese | 81.5 /100 | #143 | Excellent 98.1% |
| Alsatians | 80.4 /100 | #144 | Excellent 98.1% |
| Hmong | 78.8 /100 | #145 | Good 98.1% |
| Filipinos | 78.3 /100 | #146 | Good 98.0% |
| Immigrants | Israel | 77.6 /100 | #147 | Good 98.0% |
| Apache | 75.0 /100 | #148 | Good 98.0% |
| Immigrants | Greece | 74.9 /100 | #149 | Good 98.0% |
| Jordanians | 72.8 /100 | #150 | Good 98.0% |
| Soviet Union | 70.8 /100 | #151 | Good 98.0% |
| Dutch West Indians | 70.1 /100 | #152 | Good 98.0% |