Central American vs Hmong Kindergarten
COMPARE
Central American
Hmong
Kindergarten
Kindergarten Comparison
Central Americans
Hmong
96.6%
KINDERGARTEN
0.0/ 100
METRIC RATING
333rd/ 347
METRIC RANK
98.1%
KINDERGARTEN
78.8/ 100
METRIC RATING
145th/ 347
METRIC RANK
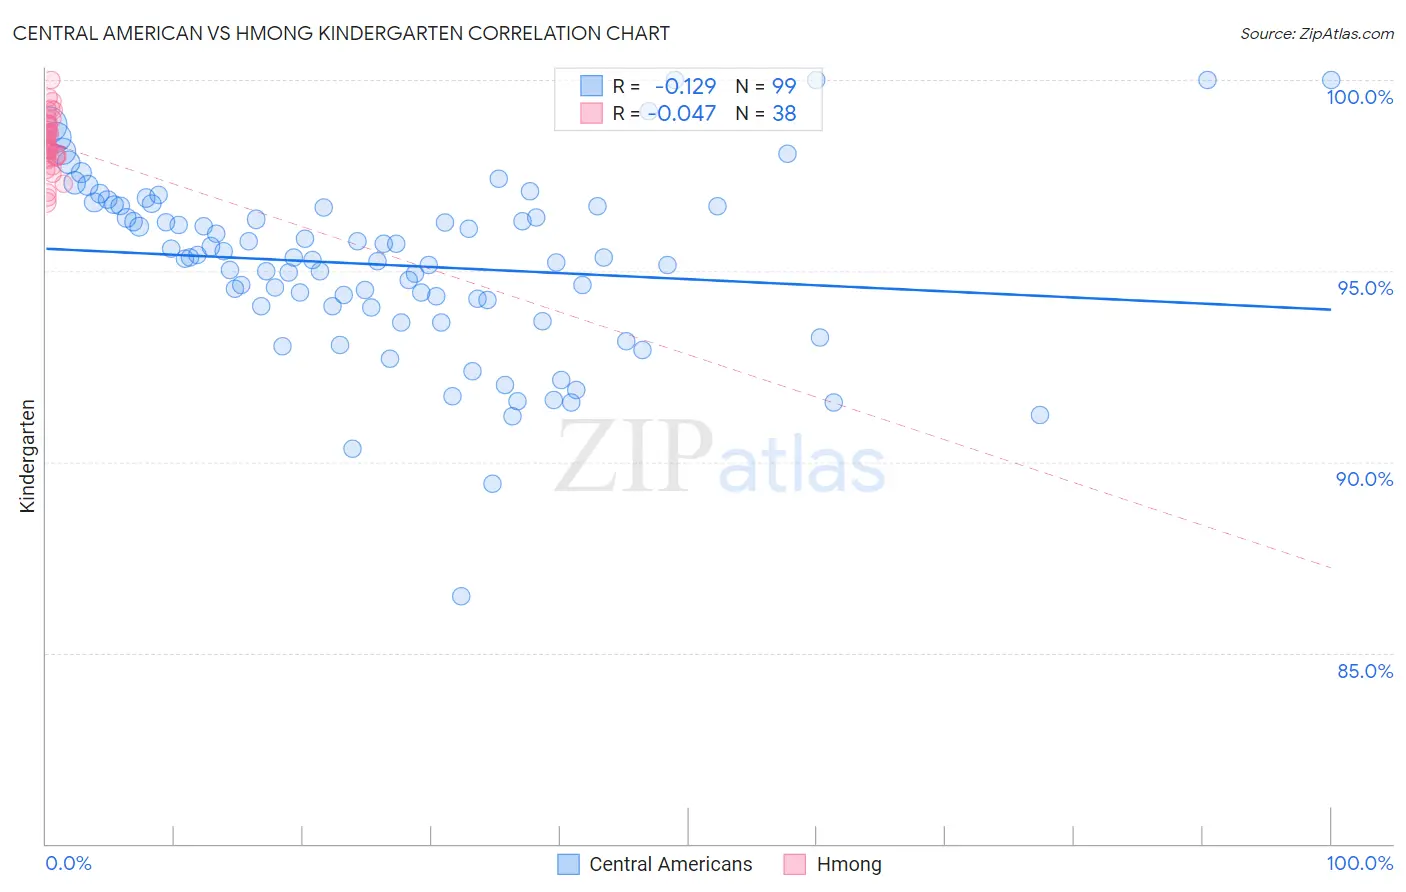
Central American vs Hmong Kindergarten Correlation Chart
The statistical analysis conducted on geographies consisting of 504,619,275 people shows a poor negative correlation between the proportion of Central Americans and percentage of population with at least kindergarten education in the United States with a correlation coefficient (R) of -0.129 and weighted average of 96.6%. Similarly, the statistical analysis conducted on geographies consisting of 24,672,093 people shows no correlation between the proportion of Hmong and percentage of population with at least kindergarten education in the United States with a correlation coefficient (R) of -0.047 and weighted average of 98.1%, a difference of 1.5%.
Kindergarten Correlation Summary
| Measurement | Central American | Hmong |
| Minimum | 86.5% | 96.8% |
| Maximum | 100.0% | 100.0% |
| Range | 13.5% | 3.2% |
| Mean | 95.2% | 98.4% |
| Median | 95.3% | 98.3% |
| Interquartile 25% (IQ1) | 94.1% | 98.0% |
| Interquartile 75% (IQ3) | 96.7% | 98.9% |
| Interquartile Range (IQR) | 2.6% | 0.90% |
| Standard Deviation (Sample) | 2.3% | 0.73% |
| Standard Deviation (Population) | 2.3% | 0.72% |
Similar Demographics by Kindergarten
Demographics Similar to Central Americans by Kindergarten
In terms of kindergarten, the demographic groups most similar to Central Americans are Yakama (96.6%, a difference of 0.020%), Immigrants from Dominican Republic (96.6%, a difference of 0.020%), Bangladeshi (96.6%, a difference of 0.030%), Immigrants from Armenia (96.6%, a difference of 0.040%), and Guatemalan (96.5%, a difference of 0.060%).
| Demographics | Rating | Rank | Kindergarten |
| Dominicans | 0.0 /100 | #326 | Tragic 96.8% |
| Mexicans | 0.0 /100 | #327 | Tragic 96.7% |
| Immigrants | Latin America | 0.0 /100 | #328 | Tragic 96.7% |
| Immigrants | Vietnam | 0.0 /100 | #329 | Tragic 96.7% |
| Japanese | 0.0 /100 | #330 | Tragic 96.7% |
| Immigrants | Armenia | 0.0 /100 | #331 | Tragic 96.6% |
| Yakama | 0.0 /100 | #332 | Tragic 96.6% |
| Central Americans | 0.0 /100 | #333 | Tragic 96.6% |
| Immigrants | Dominican Republic | 0.0 /100 | #334 | Tragic 96.6% |
| Bangladeshis | 0.0 /100 | #335 | Tragic 96.6% |
| Guatemalans | 0.0 /100 | #336 | Tragic 96.5% |
| Immigrants | Cambodia | 0.0 /100 | #337 | Tragic 96.5% |
| Immigrants | Fiji | 0.0 /100 | #338 | Tragic 96.5% |
| Immigrants | Guatemala | 0.0 /100 | #339 | Tragic 96.4% |
| Immigrants | Central America | 0.0 /100 | #340 | Tragic 96.4% |
Demographics Similar to Hmong by Kindergarten
In terms of kindergarten, the demographic groups most similar to Hmong are Filipino (98.0%, a difference of 0.0%), Burmese (98.1%, a difference of 0.010%), Alsatian (98.1%, a difference of 0.010%), Immigrants from Israel (98.0%, a difference of 0.010%), and Palestinian (98.1%, a difference of 0.020%).
| Demographics | Rating | Rank | Kindergarten |
| Immigrants | Romania | 87.7 /100 | #138 | Excellent 98.1% |
| Israelis | 87.7 /100 | #139 | Excellent 98.1% |
| Palestinians | 83.6 /100 | #140 | Excellent 98.1% |
| Marshallese | 83.0 /100 | #141 | Excellent 98.1% |
| Immigrants | Turkey | 82.8 /100 | #142 | Excellent 98.1% |
| Burmese | 81.5 /100 | #143 | Excellent 98.1% |
| Alsatians | 80.4 /100 | #144 | Excellent 98.1% |
| Hmong | 78.8 /100 | #145 | Good 98.1% |
| Filipinos | 78.3 /100 | #146 | Good 98.0% |
| Immigrants | Israel | 77.6 /100 | #147 | Good 98.0% |
| Apache | 75.0 /100 | #148 | Good 98.0% |
| Immigrants | Greece | 74.9 /100 | #149 | Good 98.0% |
| Jordanians | 72.8 /100 | #150 | Good 98.0% |
| Soviet Union | 70.8 /100 | #151 | Good 98.0% |
| Dutch West Indians | 70.1 /100 | #152 | Good 98.0% |