Immigrants from Eastern Asia vs Immigrants from North America Associate's Degree
COMPARE
Immigrants from Eastern Asia
Immigrants from North America
Associate's Degree
Associate's Degree Comparison
Immigrants from Eastern Asia
Immigrants from North America
55.4%
ASSOCIATE'S DEGREE
100.0/ 100
METRIC RATING
15th/ 347
METRIC RANK
50.1%
ASSOCIATE'S DEGREE
98.7/ 100
METRIC RATING
92nd/ 347
METRIC RANK
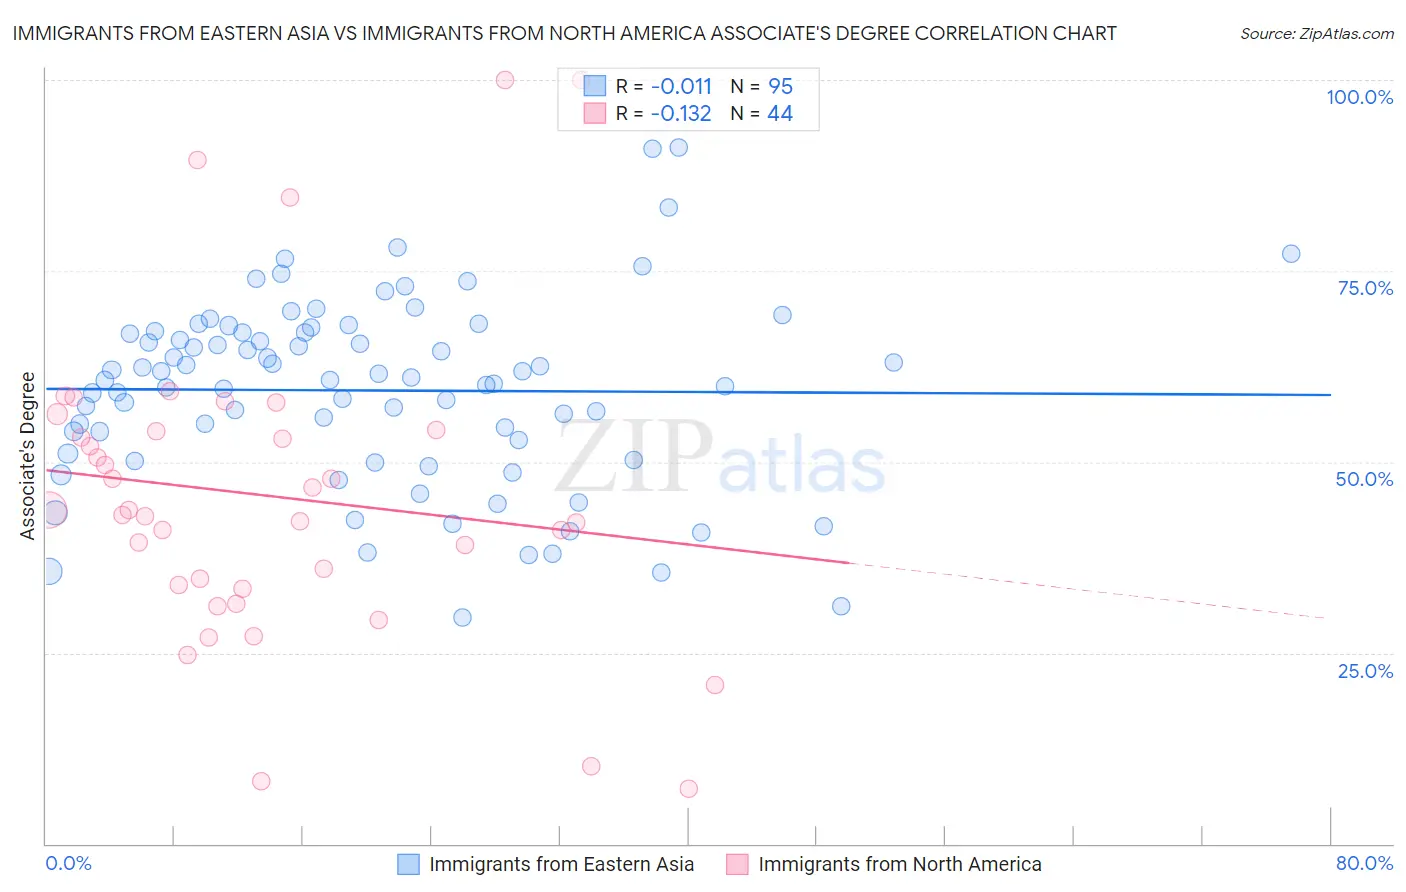
Immigrants from Eastern Asia vs Immigrants from North America Associate's Degree Correlation Chart
The statistical analysis conducted on geographies consisting of 499,873,400 people shows no correlation between the proportion of Immigrants from Eastern Asia and percentage of population with at least associate's degree education in the United States with a correlation coefficient (R) of -0.011 and weighted average of 55.4%. Similarly, the statistical analysis conducted on geographies consisting of 462,434,172 people shows a poor negative correlation between the proportion of Immigrants from North America and percentage of population with at least associate's degree education in the United States with a correlation coefficient (R) of -0.132 and weighted average of 50.1%, a difference of 10.6%.
Associate's Degree Correlation Summary
| Measurement | Immigrants from Eastern Asia | Immigrants from North America |
| Minimum | 29.6% | 7.1% |
| Maximum | 91.1% | 100.0% |
| Range | 61.5% | 92.9% |
| Mean | 59.3% | 45.6% |
| Median | 60.8% | 43.4% |
| Interquartile 25% (IQ1) | 51.1% | 33.6% |
| Interquartile 75% (IQ3) | 66.9% | 54.1% |
| Interquartile Range (IQR) | 15.8% | 20.5% |
| Standard Deviation (Sample) | 12.2% | 20.4% |
| Standard Deviation (Population) | 12.2% | 20.1% |
Similar Demographics by Associate's Degree
Demographics Similar to Immigrants from Eastern Asia by Associate's Degree
In terms of associate's degree, the demographic groups most similar to Immigrants from Eastern Asia are Immigrants from Hong Kong (55.4%, a difference of 0.030%), Immigrants from China (55.5%, a difference of 0.17%), Soviet Union (55.1%, a difference of 0.47%), Eastern European (55.0%, a difference of 0.61%), and Immigrants from South Central Asia (55.7%, a difference of 0.67%).
| Demographics | Rating | Rank | Associate's Degree |
| Thais | 100.0 /100 | #8 | Exceptional 57.4% |
| Immigrants | Israel | 100.0 /100 | #9 | Exceptional 56.8% |
| Cypriots | 100.0 /100 | #10 | Exceptional 56.4% |
| Immigrants | Australia | 100.0 /100 | #11 | Exceptional 55.8% |
| Immigrants | South Central Asia | 100.0 /100 | #12 | Exceptional 55.7% |
| Immigrants | China | 100.0 /100 | #13 | Exceptional 55.5% |
| Immigrants | Hong Kong | 100.0 /100 | #14 | Exceptional 55.4% |
| Immigrants | Eastern Asia | 100.0 /100 | #15 | Exceptional 55.4% |
| Soviet Union | 100.0 /100 | #16 | Exceptional 55.1% |
| Eastern Europeans | 100.0 /100 | #17 | Exceptional 55.0% |
| Indians (Asian) | 100.0 /100 | #18 | Exceptional 54.8% |
| Immigrants | Ireland | 100.0 /100 | #19 | Exceptional 54.7% |
| Cambodians | 100.0 /100 | #20 | Exceptional 54.6% |
| Immigrants | Sweden | 100.0 /100 | #21 | Exceptional 54.6% |
| Immigrants | Japan | 100.0 /100 | #22 | Exceptional 54.6% |
Demographics Similar to Immigrants from North America by Associate's Degree
In terms of associate's degree, the demographic groups most similar to Immigrants from North America are Immigrants from Western Asia (50.1%, a difference of 0.020%), Immigrants from Ethiopia (50.1%, a difference of 0.10%), Immigrants from Canada (50.1%, a difference of 0.11%), Immigrants from Western Europe (50.1%, a difference of 0.11%), and Immigrants from Brazil (50.0%, a difference of 0.15%).
| Demographics | Rating | Rank | Associate's Degree |
| Immigrants | Egypt | 98.9 /100 | #85 | Exceptional 50.2% |
| Immigrants | Croatia | 98.9 /100 | #86 | Exceptional 50.2% |
| Immigrants | Moldova | 98.8 /100 | #87 | Exceptional 50.2% |
| Immigrants | Canada | 98.7 /100 | #88 | Exceptional 50.1% |
| Immigrants | Western Europe | 98.7 /100 | #89 | Exceptional 50.1% |
| Immigrants | Ethiopia | 98.7 /100 | #90 | Exceptional 50.1% |
| Immigrants | Western Asia | 98.7 /100 | #91 | Exceptional 50.1% |
| Immigrants | North America | 98.7 /100 | #92 | Exceptional 50.1% |
| Immigrants | Brazil | 98.5 /100 | #93 | Exceptional 50.0% |
| Laotians | 98.4 /100 | #94 | Exceptional 49.9% |
| Immigrants | England | 98.0 /100 | #95 | Exceptional 49.7% |
| Romanians | 98.0 /100 | #96 | Exceptional 49.7% |
| Immigrants | Ukraine | 98.0 /100 | #97 | Exceptional 49.7% |
| Immigrants | Northern Africa | 97.9 /100 | #98 | Exceptional 49.7% |
| Macedonians | 97.8 /100 | #99 | Exceptional 49.6% |