Immigrants from Eastern Africa vs Paraguayan High School Diploma
COMPARE
Immigrants from Eastern Africa
Paraguayan
High School Diploma
High School Diploma Comparison
Immigrants from Eastern Africa
Paraguayans
88.9%
HIGH SCHOOL DIPLOMA
35.8/ 100
METRIC RATING
186th/ 347
METRIC RANK
89.5%
HIGH SCHOOL DIPLOMA
71.4/ 100
METRIC RATING
151st/ 347
METRIC RANK
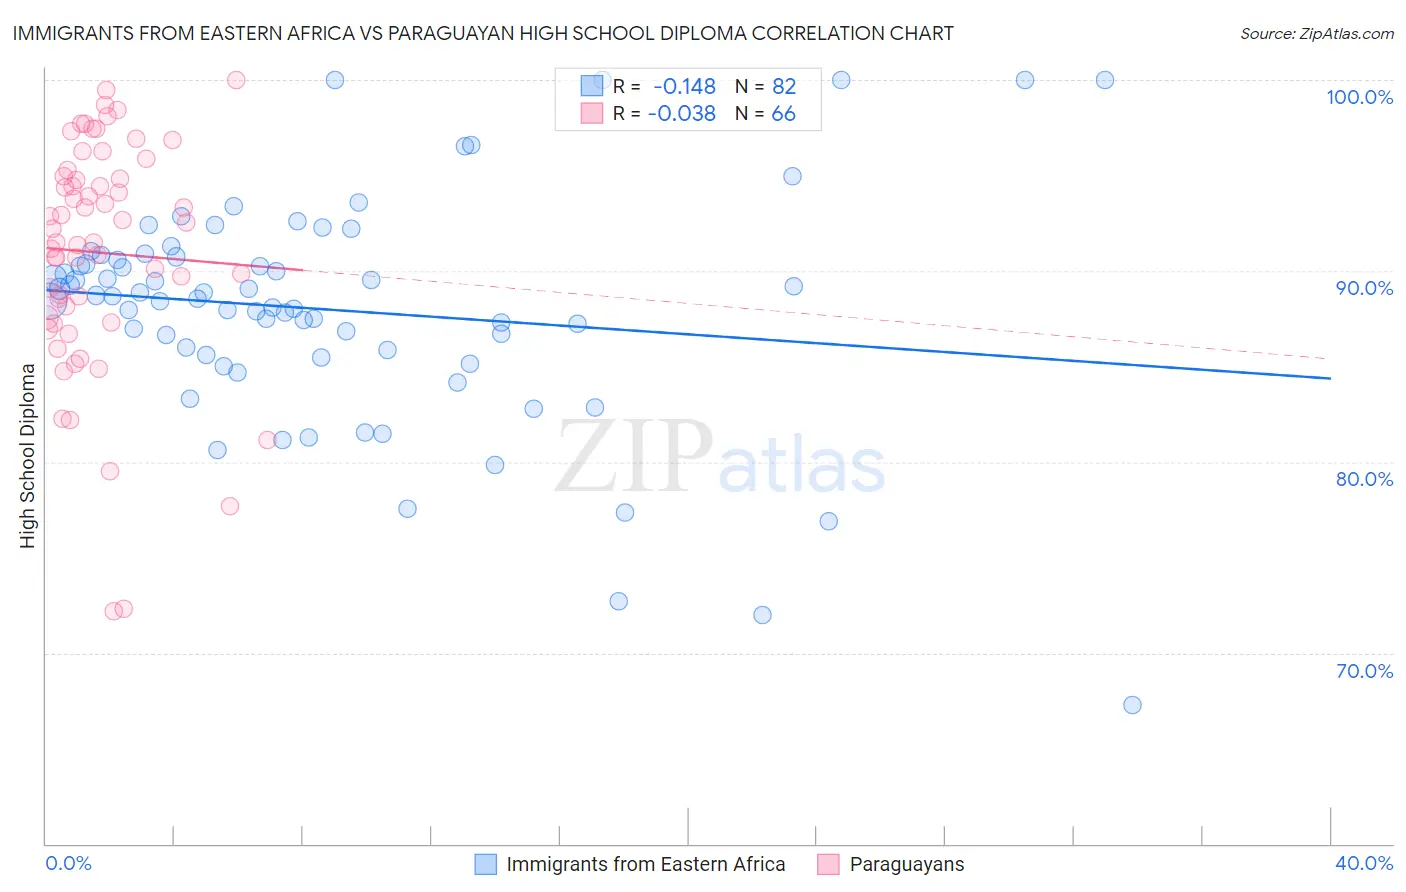
Immigrants from Eastern Africa vs Paraguayan High School Diploma Correlation Chart
The statistical analysis conducted on geographies consisting of 355,153,076 people shows a poor negative correlation between the proportion of Immigrants from Eastern Africa and percentage of population with at least high school diploma education in the United States with a correlation coefficient (R) of -0.148 and weighted average of 88.9%. Similarly, the statistical analysis conducted on geographies consisting of 95,114,201 people shows no correlation between the proportion of Paraguayans and percentage of population with at least high school diploma education in the United States with a correlation coefficient (R) of -0.038 and weighted average of 89.5%, a difference of 0.57%.
High School Diploma Correlation Summary
| Measurement | Immigrants from Eastern Africa | Paraguayan |
| Minimum | 67.3% | 72.2% |
| Maximum | 100.0% | 100.0% |
| Range | 32.7% | 27.8% |
| Mean | 88.0% | 91.0% |
| Median | 88.6% | 91.9% |
| Interquartile 25% (IQ1) | 85.6% | 87.6% |
| Interquartile 75% (IQ3) | 90.7% | 95.0% |
| Interquartile Range (IQR) | 5.2% | 7.4% |
| Standard Deviation (Sample) | 6.0% | 6.0% |
| Standard Deviation (Population) | 6.0% | 6.0% |
Similar Demographics by High School Diploma
Demographics Similar to Immigrants from Eastern Africa by High School Diploma
In terms of high school diploma, the demographic groups most similar to Immigrants from Eastern Africa are Guamanian/Chamorro (88.9%, a difference of 0.0%), Ethiopian (89.0%, a difference of 0.020%), Immigrants from Sudan (88.9%, a difference of 0.040%), Immigrants from Uganda (88.9%, a difference of 0.050%), and Immigrants from Syria (89.0%, a difference of 0.060%).
| Demographics | Rating | Rank | High School Diploma |
| Americans | 47.2 /100 | #179 | Average 89.1% |
| Bolivians | 45.2 /100 | #180 | Average 89.1% |
| Venezuelans | 43.6 /100 | #181 | Average 89.1% |
| Spaniards | 43.4 /100 | #182 | Average 89.1% |
| Potawatomi | 42.5 /100 | #183 | Average 89.0% |
| Immigrants | Syria | 39.2 /100 | #184 | Fair 89.0% |
| Ethiopians | 37.0 /100 | #185 | Fair 89.0% |
| Immigrants | Eastern Africa | 35.8 /100 | #186 | Fair 88.9% |
| Guamanians/Chamorros | 35.5 /100 | #187 | Fair 88.9% |
| Immigrants | Sudan | 33.4 /100 | #188 | Fair 88.9% |
| Immigrants | Uganda | 32.6 /100 | #189 | Fair 88.9% |
| Immigrants | Chile | 31.9 /100 | #190 | Fair 88.9% |
| Immigrants | Ethiopia | 30.9 /100 | #191 | Fair 88.9% |
| Moroccans | 29.5 /100 | #192 | Fair 88.8% |
| Immigrants | Oceania | 26.9 /100 | #193 | Fair 88.8% |
Demographics Similar to Paraguayans by High School Diploma
In terms of high school diploma, the demographic groups most similar to Paraguayans are Asian (89.4%, a difference of 0.010%), Argentinean (89.5%, a difference of 0.020%), Immigrants from Poland (89.5%, a difference of 0.030%), Immigrants from Lebanon (89.5%, a difference of 0.040%), and Iraqi (89.5%, a difference of 0.050%).
| Demographics | Rating | Rank | High School Diploma |
| Immigrants | Kenya | 78.0 /100 | #144 | Good 89.6% |
| Immigrants | Brazil | 76.6 /100 | #145 | Good 89.5% |
| Immigrants | Spain | 76.2 /100 | #146 | Good 89.5% |
| Iraqis | 73.9 /100 | #147 | Good 89.5% |
| Immigrants | Lebanon | 73.4 /100 | #148 | Good 89.5% |
| Immigrants | Poland | 72.9 /100 | #149 | Good 89.5% |
| Argentineans | 72.3 /100 | #150 | Good 89.5% |
| Paraguayans | 71.4 /100 | #151 | Good 89.5% |
| Asians | 70.7 /100 | #152 | Good 89.4% |
| Immigrants | Iraq | 68.7 /100 | #153 | Good 89.4% |
| Alsatians | 66.8 /100 | #154 | Good 89.4% |
| Immigrants | Northern Africa | 66.4 /100 | #155 | Good 89.4% |
| Immigrants | Argentina | 65.5 /100 | #156 | Good 89.4% |
| Immigrants | Malaysia | 63.5 /100 | #157 | Good 89.3% |
| Immigrants | Pakistan | 62.5 /100 | #158 | Good 89.3% |