Hopi vs Paraguayan High School Diploma
COMPARE
Hopi
Paraguayan
High School Diploma
High School Diploma Comparison
Hopi
Paraguayans
86.6%
HIGH SCHOOL DIPLOMA
0.1/ 100
METRIC RATING
278th/ 347
METRIC RANK
89.5%
HIGH SCHOOL DIPLOMA
71.4/ 100
METRIC RATING
151st/ 347
METRIC RANK
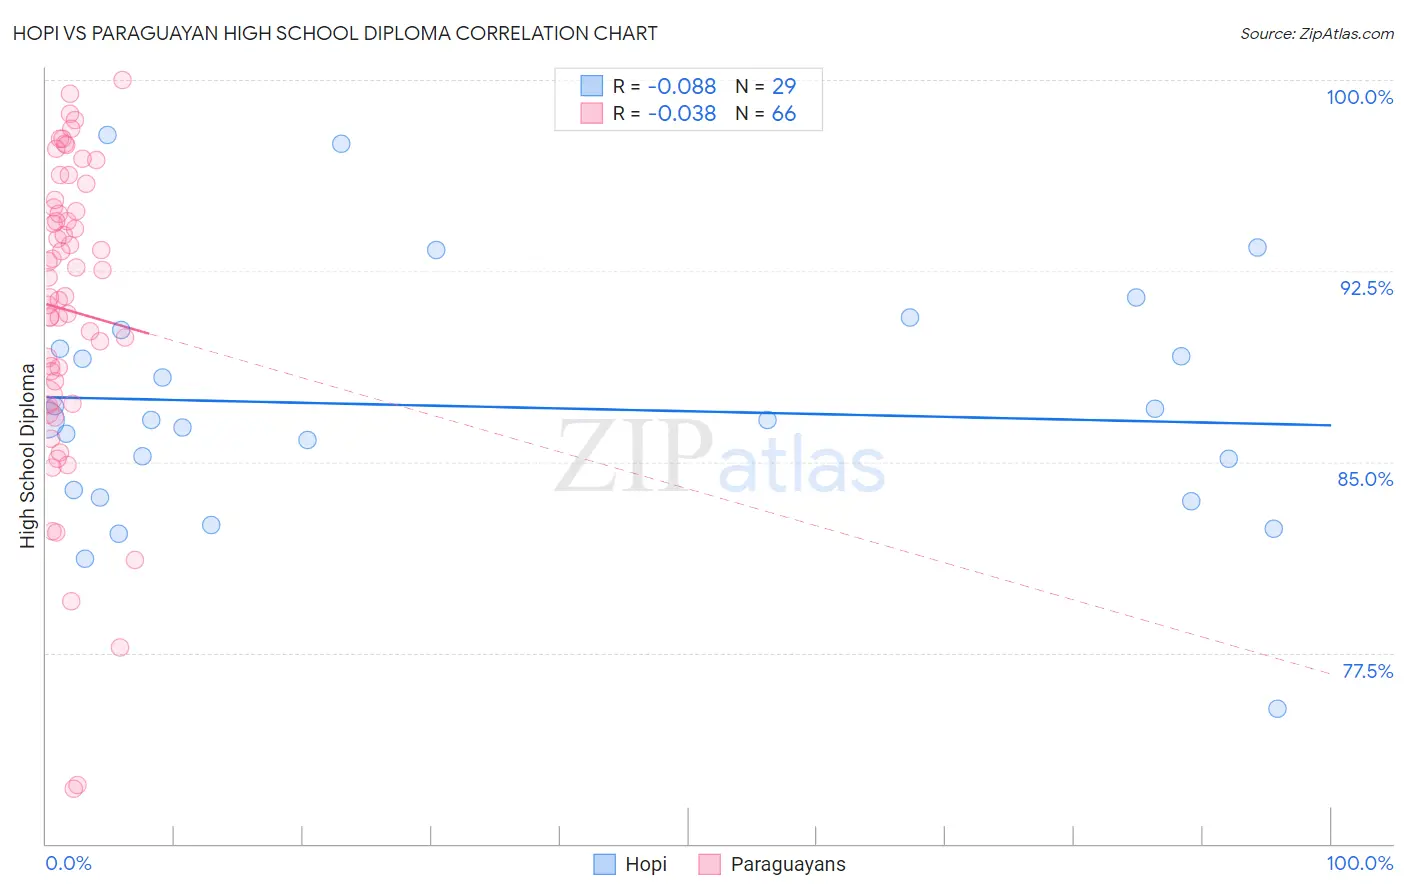
Hopi vs Paraguayan High School Diploma Correlation Chart
The statistical analysis conducted on geographies consisting of 74,739,957 people shows a slight negative correlation between the proportion of Hopi and percentage of population with at least high school diploma education in the United States with a correlation coefficient (R) of -0.088 and weighted average of 86.6%. Similarly, the statistical analysis conducted on geographies consisting of 95,114,201 people shows no correlation between the proportion of Paraguayans and percentage of population with at least high school diploma education in the United States with a correlation coefficient (R) of -0.038 and weighted average of 89.5%, a difference of 3.3%.
High School Diploma Correlation Summary
| Measurement | Hopi | Paraguayan |
| Minimum | 75.3% | 72.2% |
| Maximum | 97.8% | 100.0% |
| Range | 22.5% | 27.8% |
| Mean | 87.2% | 91.0% |
| Median | 86.6% | 91.9% |
| Interquartile 25% (IQ1) | 83.8% | 87.6% |
| Interquartile 75% (IQ3) | 89.8% | 95.0% |
| Interquartile Range (IQR) | 6.1% | 7.4% |
| Standard Deviation (Sample) | 4.8% | 6.0% |
| Standard Deviation (Population) | 4.7% | 6.0% |
Similar Demographics by High School Diploma
Demographics Similar to Hopi by High School Diploma
In terms of high school diploma, the demographic groups most similar to Hopi are Immigrants from Laos (86.6%, a difference of 0.050%), Pueblo (86.5%, a difference of 0.060%), Immigrants from Burma/Myanmar (86.7%, a difference of 0.11%), Barbadian (86.7%, a difference of 0.11%), and Indonesian (86.5%, a difference of 0.11%).
| Demographics | Rating | Rank | High School Diploma |
| West Indians | 0.1 /100 | #271 | Tragic 86.9% |
| Trinidadians and Tobagonians | 0.1 /100 | #272 | Tragic 86.9% |
| Immigrants | Jamaica | 0.1 /100 | #273 | Tragic 86.9% |
| Bangladeshis | 0.1 /100 | #274 | Tragic 86.9% |
| Immigrants | Trinidad and Tobago | 0.1 /100 | #275 | Tragic 86.8% |
| Immigrants | Burma/Myanmar | 0.1 /100 | #276 | Tragic 86.7% |
| Barbadians | 0.1 /100 | #277 | Tragic 86.7% |
| Hopi | 0.1 /100 | #278 | Tragic 86.6% |
| Immigrants | Laos | 0.0 /100 | #279 | Tragic 86.6% |
| Pueblo | 0.0 /100 | #280 | Tragic 86.5% |
| Indonesians | 0.0 /100 | #281 | Tragic 86.5% |
| Dutch West Indians | 0.0 /100 | #282 | Tragic 86.5% |
| Immigrants | Barbados | 0.0 /100 | #283 | Tragic 86.4% |
| Paiute | 0.0 /100 | #284 | Tragic 86.4% |
| Immigrants | West Indies | 0.0 /100 | #285 | Tragic 86.2% |
Demographics Similar to Paraguayans by High School Diploma
In terms of high school diploma, the demographic groups most similar to Paraguayans are Asian (89.4%, a difference of 0.010%), Argentinean (89.5%, a difference of 0.020%), Immigrants from Poland (89.5%, a difference of 0.030%), Immigrants from Lebanon (89.5%, a difference of 0.040%), and Iraqi (89.5%, a difference of 0.050%).
| Demographics | Rating | Rank | High School Diploma |
| Immigrants | Kenya | 78.0 /100 | #144 | Good 89.6% |
| Immigrants | Brazil | 76.6 /100 | #145 | Good 89.5% |
| Immigrants | Spain | 76.2 /100 | #146 | Good 89.5% |
| Iraqis | 73.9 /100 | #147 | Good 89.5% |
| Immigrants | Lebanon | 73.4 /100 | #148 | Good 89.5% |
| Immigrants | Poland | 72.9 /100 | #149 | Good 89.5% |
| Argentineans | 72.3 /100 | #150 | Good 89.5% |
| Paraguayans | 71.4 /100 | #151 | Good 89.5% |
| Asians | 70.7 /100 | #152 | Good 89.4% |
| Immigrants | Iraq | 68.7 /100 | #153 | Good 89.4% |
| Alsatians | 66.8 /100 | #154 | Good 89.4% |
| Immigrants | Northern Africa | 66.4 /100 | #155 | Good 89.4% |
| Immigrants | Argentina | 65.5 /100 | #156 | Good 89.4% |
| Immigrants | Malaysia | 63.5 /100 | #157 | Good 89.3% |
| Immigrants | Pakistan | 62.5 /100 | #158 | Good 89.3% |