Immigrants from Caribbean vs Paraguayan High School Diploma
COMPARE
Immigrants from Caribbean
Paraguayan
High School Diploma
High School Diploma Comparison
Immigrants from Caribbean
Paraguayans
84.3%
HIGH SCHOOL DIPLOMA
0.0/ 100
METRIC RATING
317th/ 347
METRIC RANK
89.5%
HIGH SCHOOL DIPLOMA
71.4/ 100
METRIC RATING
151st/ 347
METRIC RANK
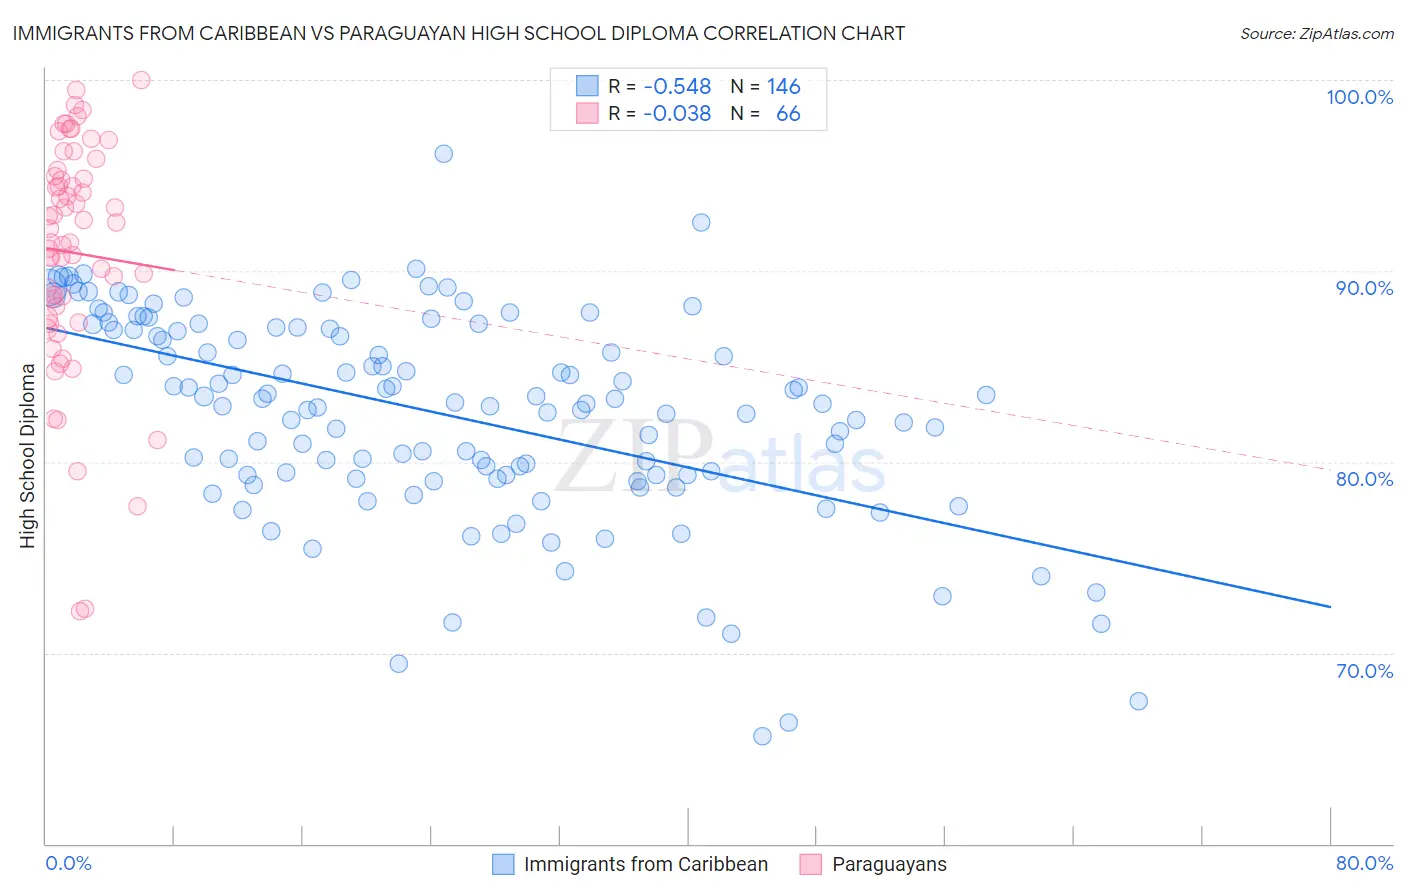
Immigrants from Caribbean vs Paraguayan High School Diploma Correlation Chart
The statistical analysis conducted on geographies consisting of 450,064,503 people shows a substantial negative correlation between the proportion of Immigrants from Caribbean and percentage of population with at least high school diploma education in the United States with a correlation coefficient (R) of -0.548 and weighted average of 84.3%. Similarly, the statistical analysis conducted on geographies consisting of 95,114,201 people shows no correlation between the proportion of Paraguayans and percentage of population with at least high school diploma education in the United States with a correlation coefficient (R) of -0.038 and weighted average of 89.5%, a difference of 6.1%.
High School Diploma Correlation Summary
| Measurement | Immigrants from Caribbean | Paraguayan |
| Minimum | 65.6% | 72.2% |
| Maximum | 96.2% | 100.0% |
| Range | 30.5% | 27.8% |
| Mean | 82.5% | 91.0% |
| Median | 83.1% | 91.9% |
| Interquartile 25% (IQ1) | 79.3% | 87.6% |
| Interquartile 75% (IQ3) | 87.0% | 95.0% |
| Interquartile Range (IQR) | 7.7% | 7.4% |
| Standard Deviation (Sample) | 5.4% | 6.0% |
| Standard Deviation (Population) | 5.4% | 6.0% |
Similar Demographics by High School Diploma
Demographics Similar to Immigrants from Caribbean by High School Diploma
In terms of high school diploma, the demographic groups most similar to Immigrants from Caribbean are Belizean (84.3%, a difference of 0.060%), Immigrants from Belize (84.2%, a difference of 0.070%), Central American Indian (84.2%, a difference of 0.11%), Nicaraguan (84.1%, a difference of 0.21%), and Yuman (84.0%, a difference of 0.34%).
| Demographics | Rating | Rank | High School Diploma |
| Apache | 0.0 /100 | #310 | Tragic 85.1% |
| Ecuadorians | 0.0 /100 | #311 | Tragic 85.1% |
| Cape Verdeans | 0.0 /100 | #312 | Tragic 85.1% |
| Immigrants | Ecuador | 0.0 /100 | #313 | Tragic 84.8% |
| Yaqui | 0.0 /100 | #314 | Tragic 84.7% |
| Puerto Ricans | 0.0 /100 | #315 | Tragic 84.7% |
| Belizeans | 0.0 /100 | #316 | Tragic 84.3% |
| Immigrants | Caribbean | 0.0 /100 | #317 | Tragic 84.3% |
| Immigrants | Belize | 0.0 /100 | #318 | Tragic 84.2% |
| Central American Indians | 0.0 /100 | #319 | Tragic 84.2% |
| Nicaraguans | 0.0 /100 | #320 | Tragic 84.1% |
| Yuman | 0.0 /100 | #321 | Tragic 84.0% |
| Lumbee | 0.0 /100 | #322 | Tragic 83.6% |
| Immigrants | Cuba | 0.0 /100 | #323 | Tragic 83.5% |
| Immigrants | Cabo Verde | 0.0 /100 | #324 | Tragic 83.3% |
Demographics Similar to Paraguayans by High School Diploma
In terms of high school diploma, the demographic groups most similar to Paraguayans are Asian (89.4%, a difference of 0.010%), Argentinean (89.5%, a difference of 0.020%), Immigrants from Poland (89.5%, a difference of 0.030%), Immigrants from Lebanon (89.5%, a difference of 0.040%), and Iraqi (89.5%, a difference of 0.050%).
| Demographics | Rating | Rank | High School Diploma |
| Immigrants | Kenya | 78.0 /100 | #144 | Good 89.6% |
| Immigrants | Brazil | 76.6 /100 | #145 | Good 89.5% |
| Immigrants | Spain | 76.2 /100 | #146 | Good 89.5% |
| Iraqis | 73.9 /100 | #147 | Good 89.5% |
| Immigrants | Lebanon | 73.4 /100 | #148 | Good 89.5% |
| Immigrants | Poland | 72.9 /100 | #149 | Good 89.5% |
| Argentineans | 72.3 /100 | #150 | Good 89.5% |
| Paraguayans | 71.4 /100 | #151 | Good 89.5% |
| Asians | 70.7 /100 | #152 | Good 89.4% |
| Immigrants | Iraq | 68.7 /100 | #153 | Good 89.4% |
| Alsatians | 66.8 /100 | #154 | Good 89.4% |
| Immigrants | Northern Africa | 66.4 /100 | #155 | Good 89.4% |
| Immigrants | Argentina | 65.5 /100 | #156 | Good 89.4% |
| Immigrants | Malaysia | 63.5 /100 | #157 | Good 89.3% |
| Immigrants | Pakistan | 62.5 /100 | #158 | Good 89.3% |