Immigrants from Eastern Africa vs Native/Alaskan High School Diploma
COMPARE
Immigrants from Eastern Africa
Native/Alaskan
High School Diploma
High School Diploma Comparison
Immigrants from Eastern Africa
Natives/Alaskans
88.9%
HIGH SCHOOL DIPLOMA
35.8/ 100
METRIC RATING
186th/ 347
METRIC RANK
85.6%
HIGH SCHOOL DIPLOMA
0.0/ 100
METRIC RATING
298th/ 347
METRIC RANK
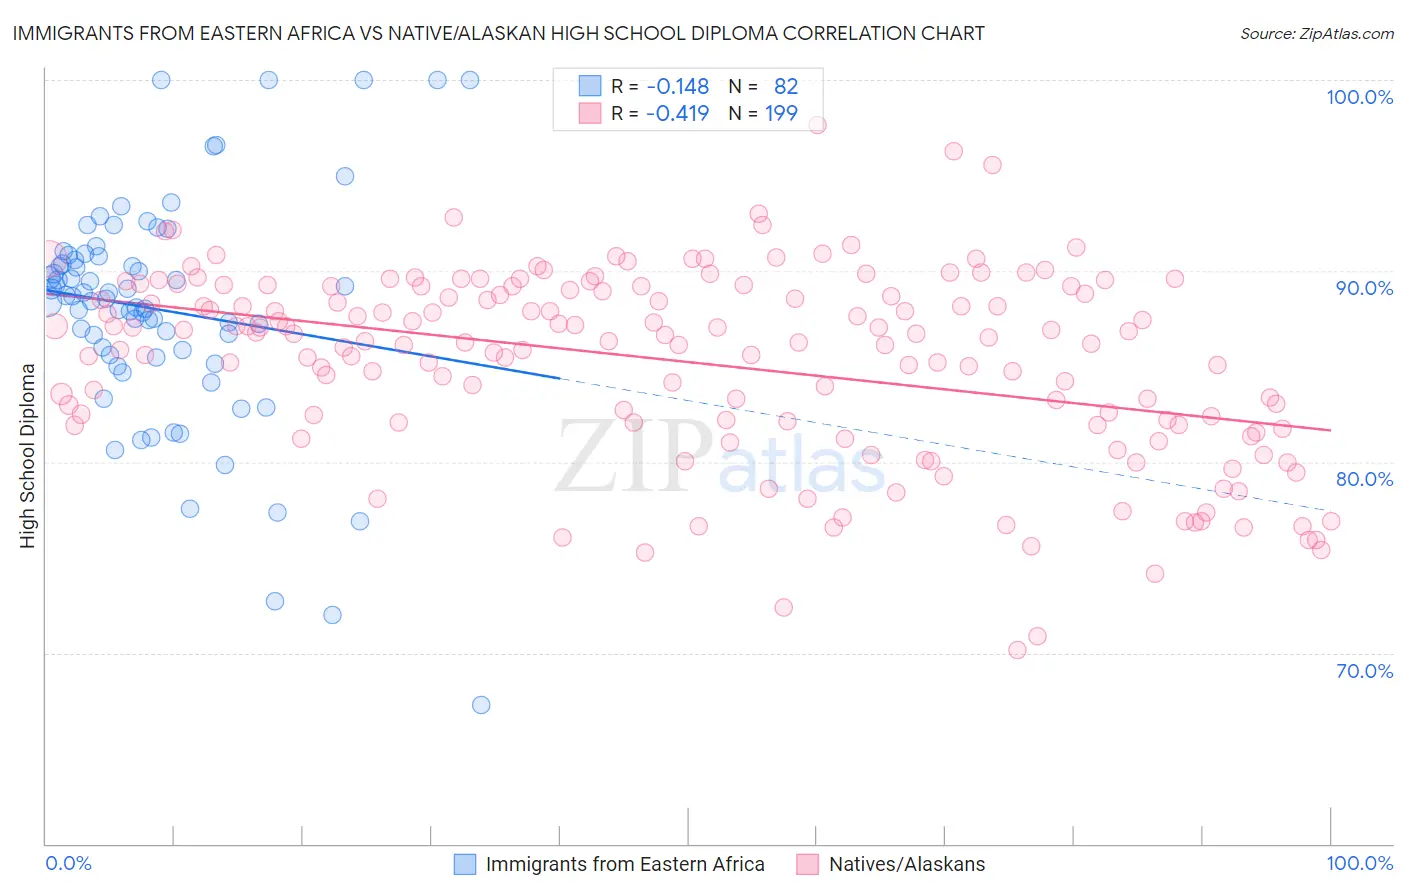
Immigrants from Eastern Africa vs Native/Alaskan High School Diploma Correlation Chart
The statistical analysis conducted on geographies consisting of 355,153,076 people shows a poor negative correlation between the proportion of Immigrants from Eastern Africa and percentage of population with at least high school diploma education in the United States with a correlation coefficient (R) of -0.148 and weighted average of 88.9%. Similarly, the statistical analysis conducted on geographies consisting of 513,075,731 people shows a moderate negative correlation between the proportion of Natives/Alaskans and percentage of population with at least high school diploma education in the United States with a correlation coefficient (R) of -0.419 and weighted average of 85.6%, a difference of 4.0%.
High School Diploma Correlation Summary
| Measurement | Immigrants from Eastern Africa | Native/Alaskan |
| Minimum | 67.3% | 70.2% |
| Maximum | 100.0% | 97.6% |
| Range | 32.7% | 27.5% |
| Mean | 88.0% | 85.2% |
| Median | 88.6% | 86.3% |
| Interquartile 25% (IQ1) | 85.6% | 82.1% |
| Interquartile 75% (IQ3) | 90.7% | 89.2% |
| Interquartile Range (IQR) | 5.2% | 7.1% |
| Standard Deviation (Sample) | 6.0% | 5.0% |
| Standard Deviation (Population) | 6.0% | 4.9% |
Similar Demographics by High School Diploma
Demographics Similar to Immigrants from Eastern Africa by High School Diploma
In terms of high school diploma, the demographic groups most similar to Immigrants from Eastern Africa are Guamanian/Chamorro (88.9%, a difference of 0.0%), Ethiopian (89.0%, a difference of 0.020%), Immigrants from Sudan (88.9%, a difference of 0.040%), Immigrants from Uganda (88.9%, a difference of 0.050%), and Immigrants from Syria (89.0%, a difference of 0.060%).
| Demographics | Rating | Rank | High School Diploma |
| Americans | 47.2 /100 | #179 | Average 89.1% |
| Bolivians | 45.2 /100 | #180 | Average 89.1% |
| Venezuelans | 43.6 /100 | #181 | Average 89.1% |
| Spaniards | 43.4 /100 | #182 | Average 89.1% |
| Potawatomi | 42.5 /100 | #183 | Average 89.0% |
| Immigrants | Syria | 39.2 /100 | #184 | Fair 89.0% |
| Ethiopians | 37.0 /100 | #185 | Fair 89.0% |
| Immigrants | Eastern Africa | 35.8 /100 | #186 | Fair 88.9% |
| Guamanians/Chamorros | 35.5 /100 | #187 | Fair 88.9% |
| Immigrants | Sudan | 33.4 /100 | #188 | Fair 88.9% |
| Immigrants | Uganda | 32.6 /100 | #189 | Fair 88.9% |
| Immigrants | Chile | 31.9 /100 | #190 | Fair 88.9% |
| Immigrants | Ethiopia | 30.9 /100 | #191 | Fair 88.9% |
| Moroccans | 29.5 /100 | #192 | Fair 88.8% |
| Immigrants | Oceania | 26.9 /100 | #193 | Fair 88.8% |
Demographics Similar to Natives/Alaskans by High School Diploma
In terms of high school diploma, the demographic groups most similar to Natives/Alaskans are Immigrants from Grenada (85.6%, a difference of 0.020%), Immigrants from Cambodia (85.6%, a difference of 0.090%), Guyanese (85.5%, a difference of 0.10%), Immigrants from Bangladesh (85.5%, a difference of 0.12%), and Vietnamese (85.4%, a difference of 0.14%).
| Demographics | Rating | Rank | High School Diploma |
| Haitians | 0.0 /100 | #291 | Tragic 85.9% |
| Japanese | 0.0 /100 | #292 | Tragic 85.9% |
| British West Indians | 0.0 /100 | #293 | Tragic 85.9% |
| Immigrants | Fiji | 0.0 /100 | #294 | Tragic 85.8% |
| Immigrants | Immigrants | 0.0 /100 | #295 | Tragic 85.8% |
| Immigrants | Cambodia | 0.0 /100 | #296 | Tragic 85.6% |
| Immigrants | Grenada | 0.0 /100 | #297 | Tragic 85.6% |
| Natives/Alaskans | 0.0 /100 | #298 | Tragic 85.6% |
| Guyanese | 0.0 /100 | #299 | Tragic 85.5% |
| Immigrants | Bangladesh | 0.0 /100 | #300 | Tragic 85.5% |
| Vietnamese | 0.0 /100 | #301 | Tragic 85.4% |
| Immigrants | Haiti | 0.0 /100 | #302 | Tragic 85.4% |
| Cubans | 0.0 /100 | #303 | Tragic 85.4% |
| Nepalese | 0.0 /100 | #304 | Tragic 85.3% |
| Immigrants | Portugal | 0.0 /100 | #305 | Tragic 85.3% |