Immigrants from Eastern Africa vs Liberian High School Diploma
COMPARE
Immigrants from Eastern Africa
Liberian
High School Diploma
High School Diploma Comparison
Immigrants from Eastern Africa
Liberians
88.9%
HIGH SCHOOL DIPLOMA
35.8/ 100
METRIC RATING
186th/ 347
METRIC RANK
88.7%
HIGH SCHOOL DIPLOMA
18.8/ 100
METRIC RATING
198th/ 347
METRIC RANK
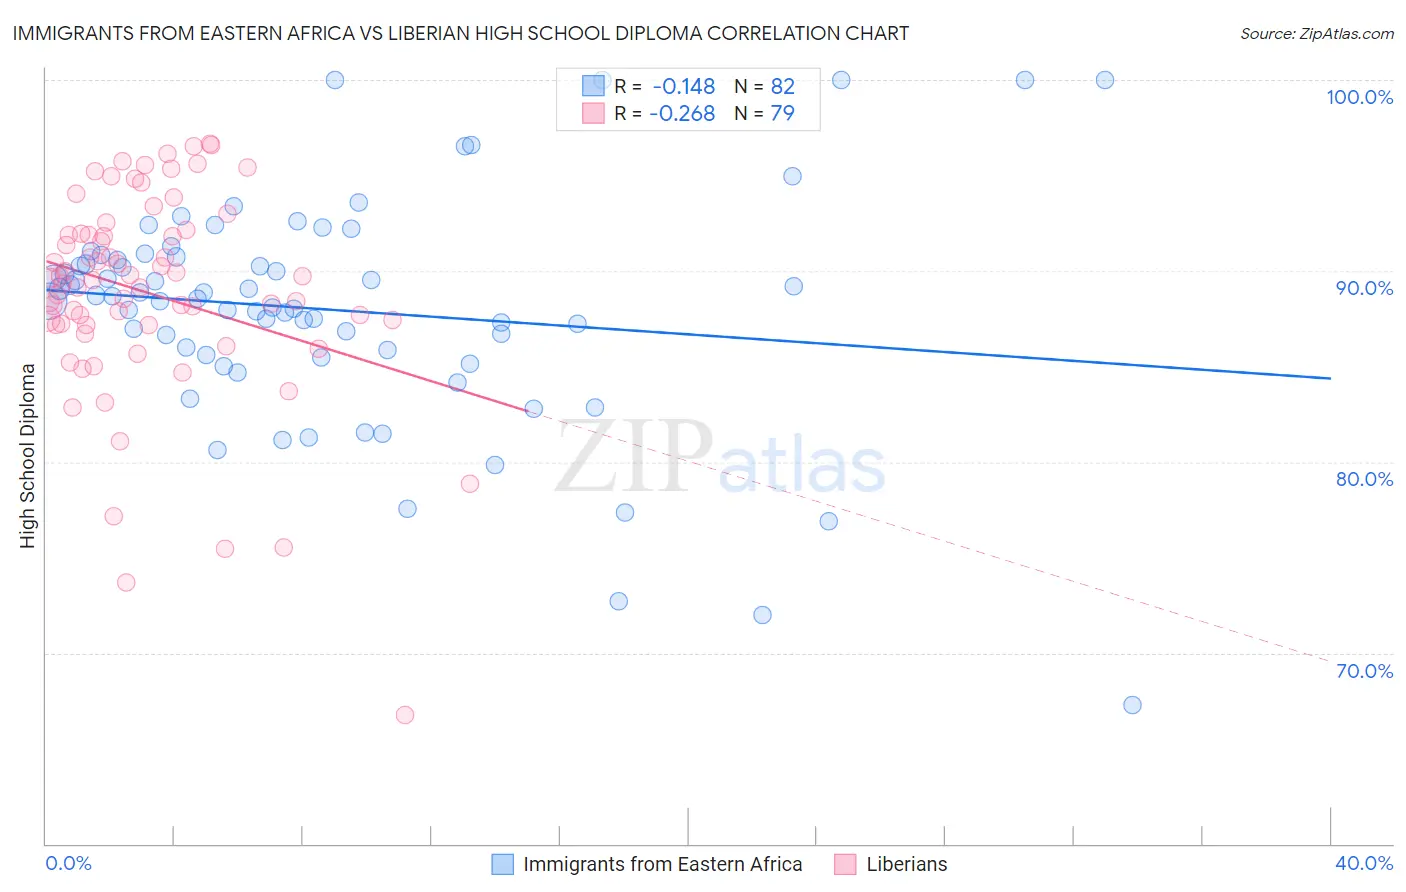
Immigrants from Eastern Africa vs Liberian High School Diploma Correlation Chart
The statistical analysis conducted on geographies consisting of 355,153,076 people shows a poor negative correlation between the proportion of Immigrants from Eastern Africa and percentage of population with at least high school diploma education in the United States with a correlation coefficient (R) of -0.148 and weighted average of 88.9%. Similarly, the statistical analysis conducted on geographies consisting of 118,101,728 people shows a weak negative correlation between the proportion of Liberians and percentage of population with at least high school diploma education in the United States with a correlation coefficient (R) of -0.268 and weighted average of 88.7%, a difference of 0.33%.
High School Diploma Correlation Summary
| Measurement | Immigrants from Eastern Africa | Liberian |
| Minimum | 67.3% | 66.8% |
| Maximum | 100.0% | 96.6% |
| Range | 32.7% | 29.9% |
| Mean | 88.0% | 88.8% |
| Median | 88.6% | 89.5% |
| Interquartile 25% (IQ1) | 85.6% | 87.2% |
| Interquartile 75% (IQ3) | 90.7% | 91.9% |
| Interquartile Range (IQR) | 5.2% | 4.8% |
| Standard Deviation (Sample) | 6.0% | 5.5% |
| Standard Deviation (Population) | 6.0% | 5.5% |
Demographics Similar to Immigrants from Eastern Africa and Liberians by High School Diploma
In terms of high school diploma, the demographic groups most similar to Immigrants from Eastern Africa are Guamanian/Chamorro (88.9%, a difference of 0.0%), Ethiopian (89.0%, a difference of 0.020%), Immigrants from Sudan (88.9%, a difference of 0.040%), Immigrants from Uganda (88.9%, a difference of 0.050%), and Immigrants from Syria (89.0%, a difference of 0.060%). Similarly, the demographic groups most similar to Liberians are Marshallese (88.6%, a difference of 0.0%), Hawaiian (88.6%, a difference of 0.010%), Korean (88.6%, a difference of 0.020%), Panamanian (88.6%, a difference of 0.020%), and French American Indian (88.7%, a difference of 0.060%).
| Demographics | Rating | Rank | High School Diploma |
| Spaniards | 43.4 /100 | #182 | Average 89.1% |
| Potawatomi | 42.5 /100 | #183 | Average 89.0% |
| Immigrants | Syria | 39.2 /100 | #184 | Fair 89.0% |
| Ethiopians | 37.0 /100 | #185 | Fair 89.0% |
| Immigrants | Eastern Africa | 35.8 /100 | #186 | Fair 88.9% |
| Guamanians/Chamorros | 35.5 /100 | #187 | Fair 88.9% |
| Immigrants | Sudan | 33.4 /100 | #188 | Fair 88.9% |
| Immigrants | Uganda | 32.6 /100 | #189 | Fair 88.9% |
| Immigrants | Chile | 31.9 /100 | #190 | Fair 88.9% |
| Immigrants | Ethiopia | 30.9 /100 | #191 | Fair 88.9% |
| Moroccans | 29.5 /100 | #192 | Fair 88.8% |
| Immigrants | Oceania | 26.9 /100 | #193 | Fair 88.8% |
| Immigrants | Venezuela | 25.8 /100 | #194 | Fair 88.8% |
| Afghans | 23.9 /100 | #195 | Fair 88.8% |
| Immigrants | Southern Europe | 23.4 /100 | #196 | Fair 88.7% |
| French American Indians | 21.5 /100 | #197 | Fair 88.7% |
| Liberians | 18.8 /100 | #198 | Poor 88.7% |
| Marshallese | 18.7 /100 | #199 | Poor 88.6% |
| Hawaiians | 18.3 /100 | #200 | Poor 88.6% |
| Koreans | 18.1 /100 | #201 | Poor 88.6% |
| Panamanians | 18.0 /100 | #202 | Poor 88.6% |