Immigrants from Greece vs Immigrants from Sierra Leone 5th Grade
COMPARE
Immigrants from Greece
Immigrants from Sierra Leone
5th Grade
5th Grade Comparison
Immigrants from Greece
Immigrants from Sierra Leone
97.5%
5TH GRADE
83.2/ 100
METRIC RATING
144th/ 347
METRIC RANK
96.8%
5TH GRADE
0.4/ 100
METRIC RATING
261st/ 347
METRIC RANK
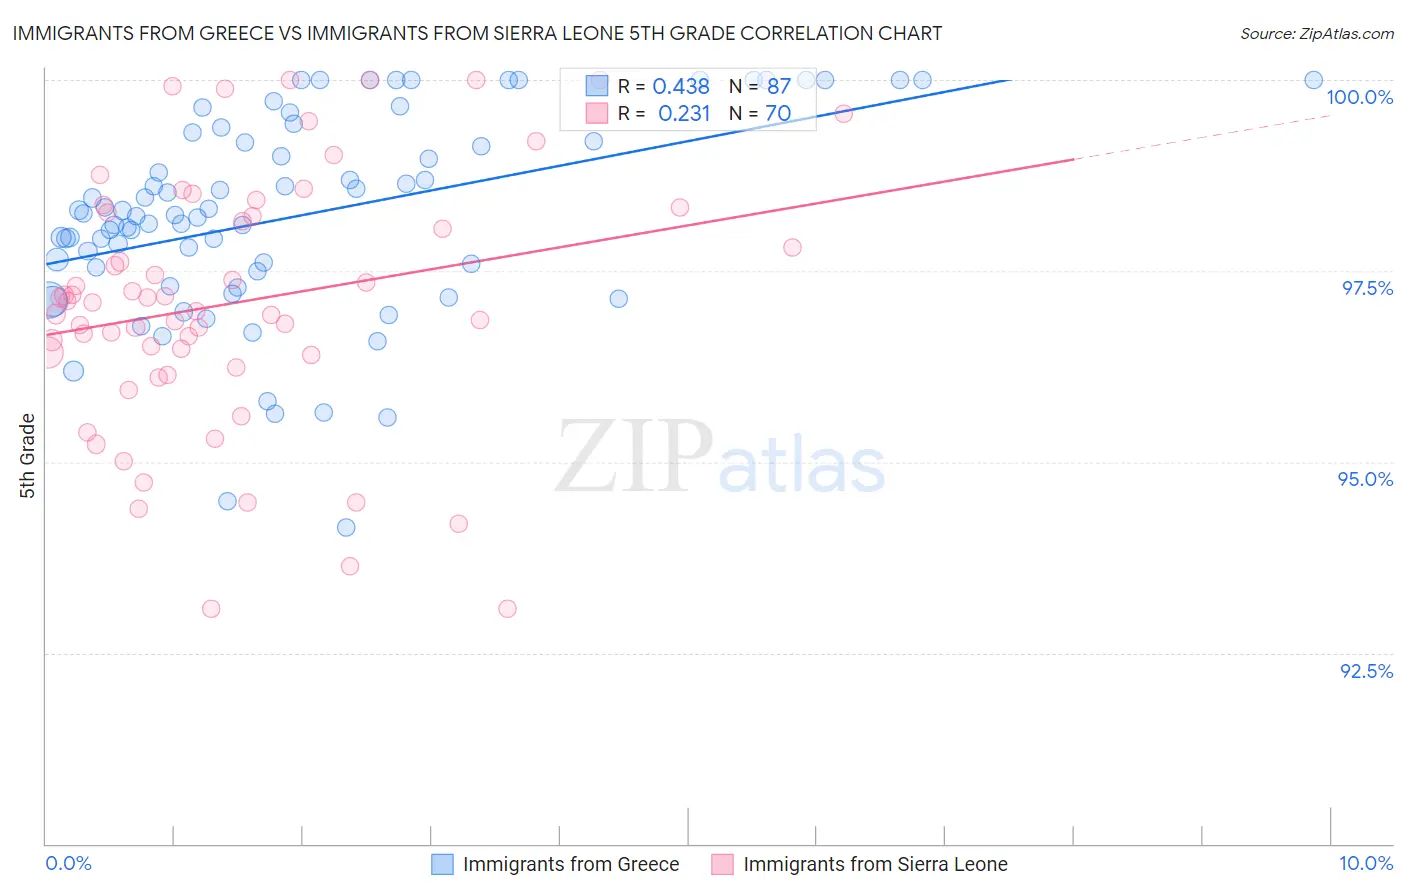
Immigrants from Greece vs Immigrants from Sierra Leone 5th Grade Correlation Chart
The statistical analysis conducted on geographies consisting of 216,879,847 people shows a moderate positive correlation between the proportion of Immigrants from Greece and percentage of population with at least 5th grade education in the United States with a correlation coefficient (R) of 0.438 and weighted average of 97.5%. Similarly, the statistical analysis conducted on geographies consisting of 101,634,956 people shows a weak positive correlation between the proportion of Immigrants from Sierra Leone and percentage of population with at least 5th grade education in the United States with a correlation coefficient (R) of 0.231 and weighted average of 96.8%, a difference of 0.75%.
5th Grade Correlation Summary
| Measurement | Immigrants from Greece | Immigrants from Sierra Leone |
| Minimum | 94.1% | 93.1% |
| Maximum | 100.0% | 100.0% |
| Range | 5.9% | 6.9% |
| Mean | 98.2% | 97.1% |
| Median | 98.2% | 97.1% |
| Interquartile 25% (IQ1) | 97.5% | 96.4% |
| Interquartile 75% (IQ3) | 99.3% | 98.3% |
| Interquartile Range (IQR) | 1.8% | 1.9% |
| Standard Deviation (Sample) | 1.3% | 1.7% |
| Standard Deviation (Population) | 1.3% | 1.7% |
Similar Demographics by 5th Grade
Demographics Similar to Immigrants from Greece by 5th Grade
In terms of 5th grade, the demographic groups most similar to Immigrants from Greece are Jordanian (97.5%, a difference of 0.0%), Spaniard (97.5%, a difference of 0.010%), Soviet Union (97.5%, a difference of 0.010%), Burmese (97.5%, a difference of 0.020%), and Seminole (97.5%, a difference of 0.020%).
| Demographics | Rating | Rank | 5th Grade |
| Filipinos | 86.8 /100 | #137 | Excellent 97.5% |
| Blackfeet | 86.8 /100 | #138 | Excellent 97.5% |
| Immigrants | Turkey | 86.7 /100 | #139 | Excellent 97.5% |
| Burmese | 86.1 /100 | #140 | Excellent 97.5% |
| Seminole | 85.8 /100 | #141 | Excellent 97.5% |
| Israelis | 85.5 /100 | #142 | Excellent 97.5% |
| Immigrants | North Macedonia | 85.4 /100 | #143 | Excellent 97.5% |
| Immigrants | Greece | 83.2 /100 | #144 | Excellent 97.5% |
| Jordanians | 82.6 /100 | #145 | Excellent 97.5% |
| Spaniards | 81.9 /100 | #146 | Excellent 97.5% |
| Soviet Union | 81.2 /100 | #147 | Excellent 97.5% |
| Immigrants | Israel | 79.1 /100 | #148 | Good 97.5% |
| Hopi | 78.6 /100 | #149 | Good 97.5% |
| Immigrants | South Central Asia | 78.6 /100 | #150 | Good 97.5% |
| Immigrants | Eastern Europe | 75.0 /100 | #151 | Good 97.4% |
Demographics Similar to Immigrants from Sierra Leone by 5th Grade
In terms of 5th grade, the demographic groups most similar to Immigrants from Sierra Leone are Immigrants from Jamaica (96.8%, a difference of 0.0%), Immigrants from Colombia (96.8%, a difference of 0.0%), Immigrants from Uzbekistan (96.8%, a difference of 0.010%), Immigrants from Ethiopia (96.8%, a difference of 0.020%), and Immigrants from China (96.8%, a difference of 0.020%).
| Demographics | Rating | Rank | 5th Grade |
| Immigrants | Senegal | 0.8 /100 | #254 | Tragic 96.8% |
| South Americans | 0.7 /100 | #255 | Tragic 96.8% |
| Immigrants | Congo | 0.7 /100 | #256 | Tragic 96.8% |
| Peruvians | 0.6 /100 | #257 | Tragic 96.8% |
| Immigrants | Ethiopia | 0.5 /100 | #258 | Tragic 96.8% |
| Immigrants | China | 0.5 /100 | #259 | Tragic 96.8% |
| Immigrants | Jamaica | 0.4 /100 | #260 | Tragic 96.8% |
| Immigrants | Sierra Leone | 0.4 /100 | #261 | Tragic 96.8% |
| Immigrants | Colombia | 0.4 /100 | #262 | Tragic 96.8% |
| Immigrants | Uzbekistan | 0.3 /100 | #263 | Tragic 96.8% |
| West Indians | 0.3 /100 | #264 | Tragic 96.8% |
| Taiwanese | 0.3 /100 | #265 | Tragic 96.7% |
| Immigrants | Nigeria | 0.3 /100 | #266 | Tragic 96.7% |
| Immigrants | South America | 0.3 /100 | #267 | Tragic 96.7% |
| Armenians | 0.3 /100 | #268 | Tragic 96.7% |