Immigrants from Eastern Africa vs Asian 5th Grade
COMPARE
Immigrants from Eastern Africa
Asian
5th Grade
5th Grade Comparison
Immigrants from Eastern Africa
Asians
96.9%
5TH GRADE
1.6/ 100
METRIC RATING
243rd/ 347
METRIC RANK
96.9%
5TH GRADE
2.0/ 100
METRIC RATING
238th/ 347
METRIC RANK
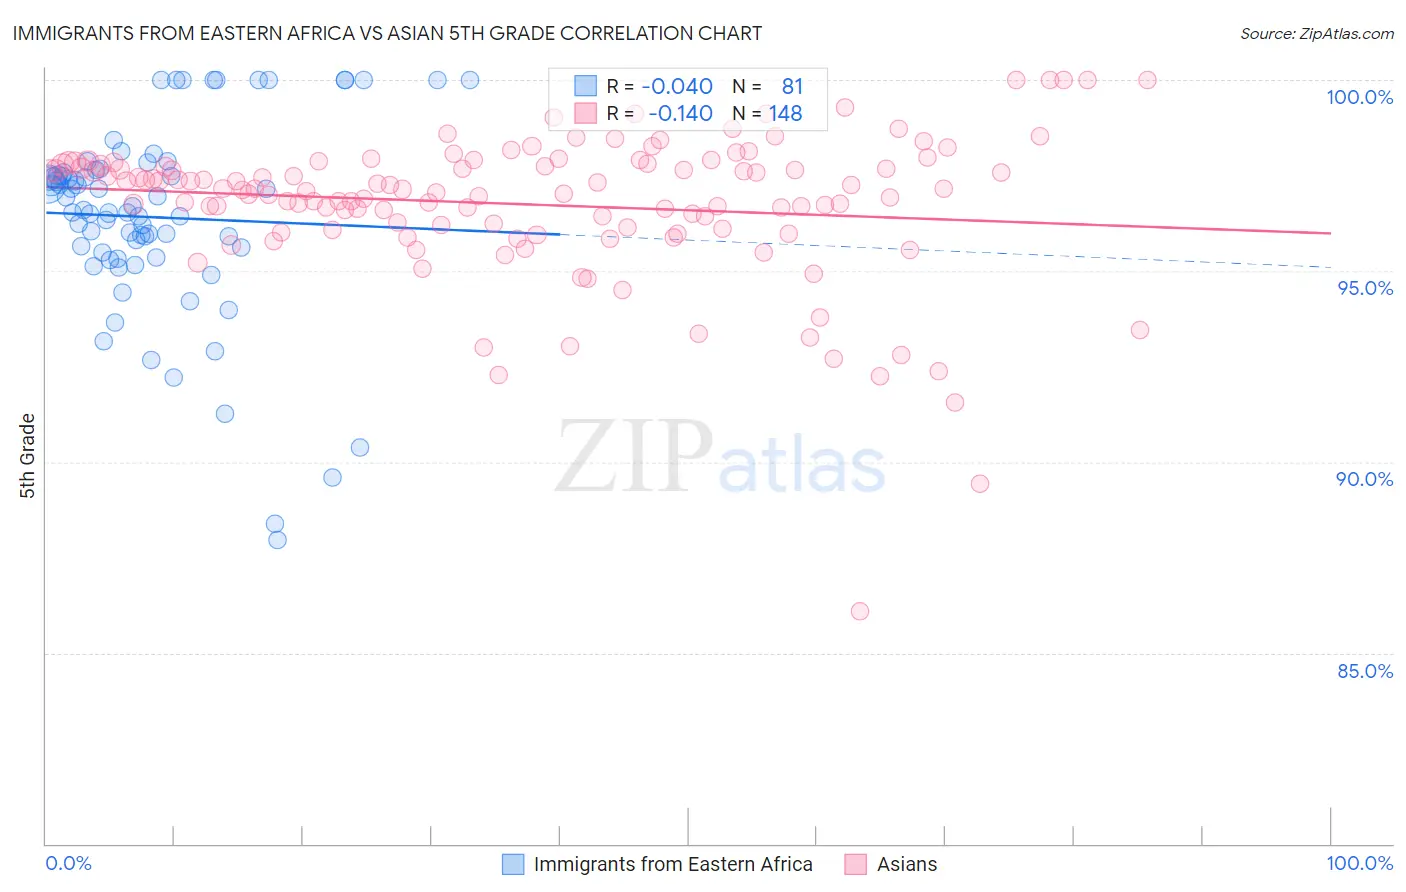
Immigrants from Eastern Africa vs Asian 5th Grade Correlation Chart
The statistical analysis conducted on geographies consisting of 355,144,184 people shows no correlation between the proportion of Immigrants from Eastern Africa and percentage of population with at least 5th grade education in the United States with a correlation coefficient (R) of -0.040 and weighted average of 96.9%. Similarly, the statistical analysis conducted on geographies consisting of 550,860,618 people shows a poor negative correlation between the proportion of Asians and percentage of population with at least 5th grade education in the United States with a correlation coefficient (R) of -0.140 and weighted average of 96.9%, a difference of 0.020%.
5th Grade Correlation Summary
| Measurement | Immigrants from Eastern Africa | Asian |
| Minimum | 87.9% | 86.1% |
| Maximum | 100.0% | 100.0% |
| Range | 12.1% | 13.9% |
| Mean | 96.4% | 96.7% |
| Median | 96.6% | 97.1% |
| Interquartile 25% (IQ1) | 95.4% | 96.1% |
| Interquartile 75% (IQ3) | 97.6% | 97.8% |
| Interquartile Range (IQR) | 2.2% | 1.7% |
| Standard Deviation (Sample) | 2.6% | 1.9% |
| Standard Deviation (Population) | 2.6% | 1.9% |
Demographics Similar to Immigrants from Eastern Africa and Asians by 5th Grade
In terms of 5th grade, the demographic groups most similar to Immigrants from Eastern Africa are Immigrants from Asia (96.9%, a difference of 0.0%), Immigrants from Costa Rica (96.9%, a difference of 0.0%), Korean (96.9%, a difference of 0.0%), Nigerian (96.9%, a difference of 0.020%), and Indian (Asian) (96.9%, a difference of 0.020%). Similarly, the demographic groups most similar to Asians are Immigrants from Indonesia (96.9%, a difference of 0.0%), Nigerian (96.9%, a difference of 0.0%), Indian (Asian) (96.9%, a difference of 0.0%), Immigrants from Asia (96.9%, a difference of 0.020%), and Immigrants from Costa Rica (96.9%, a difference of 0.020%).
| Demographics | Rating | Rank | 5th Grade |
| Immigrants | Western Asia | 4.3 /100 | #230 | Tragic 97.0% |
| Immigrants | Malaysia | 4.1 /100 | #231 | Tragic 97.0% |
| Immigrants | Eastern Asia | 4.0 /100 | #232 | Tragic 97.0% |
| Sub-Saharan Africans | 3.3 /100 | #233 | Tragic 97.0% |
| Tohono O'odham | 3.2 /100 | #234 | Tragic 97.0% |
| Uruguayans | 3.2 /100 | #235 | Tragic 97.0% |
| Senegalese | 2.8 /100 | #236 | Tragic 97.0% |
| Immigrants | Indonesia | 2.0 /100 | #237 | Tragic 96.9% |
| Asians | 2.0 /100 | #238 | Tragic 96.9% |
| Nigerians | 1.9 /100 | #239 | Tragic 96.9% |
| Indians (Asian) | 1.9 /100 | #240 | Tragic 96.9% |
| Immigrants | Asia | 1.7 /100 | #241 | Tragic 96.9% |
| Immigrants | Costa Rica | 1.6 /100 | #242 | Tragic 96.9% |
| Immigrants | Eastern Africa | 1.6 /100 | #243 | Tragic 96.9% |
| Koreans | 1.6 /100 | #244 | Tragic 96.9% |
| Colombians | 1.3 /100 | #245 | Tragic 96.9% |
| Ethiopians | 1.2 /100 | #246 | Tragic 96.9% |
| Immigrants | Africa | 1.1 /100 | #247 | Tragic 96.9% |
| U.S. Virgin Islanders | 1.1 /100 | #248 | Tragic 96.9% |
| Immigrants | Uruguay | 1.0 /100 | #249 | Tragic 96.9% |
| Immigrants | Liberia | 1.0 /100 | #250 | Tragic 96.9% |