Immigrants from Barbados vs Immigrants from Sierra Leone 5th Grade
COMPARE
Immigrants from Barbados
Immigrants from Sierra Leone
5th Grade
5th Grade Comparison
Immigrants from Barbados
Immigrants from Sierra Leone
96.6%
5TH GRADE
0.0/ 100
METRIC RATING
288th/ 347
METRIC RANK
96.8%
5TH GRADE
0.4/ 100
METRIC RATING
261st/ 347
METRIC RANK
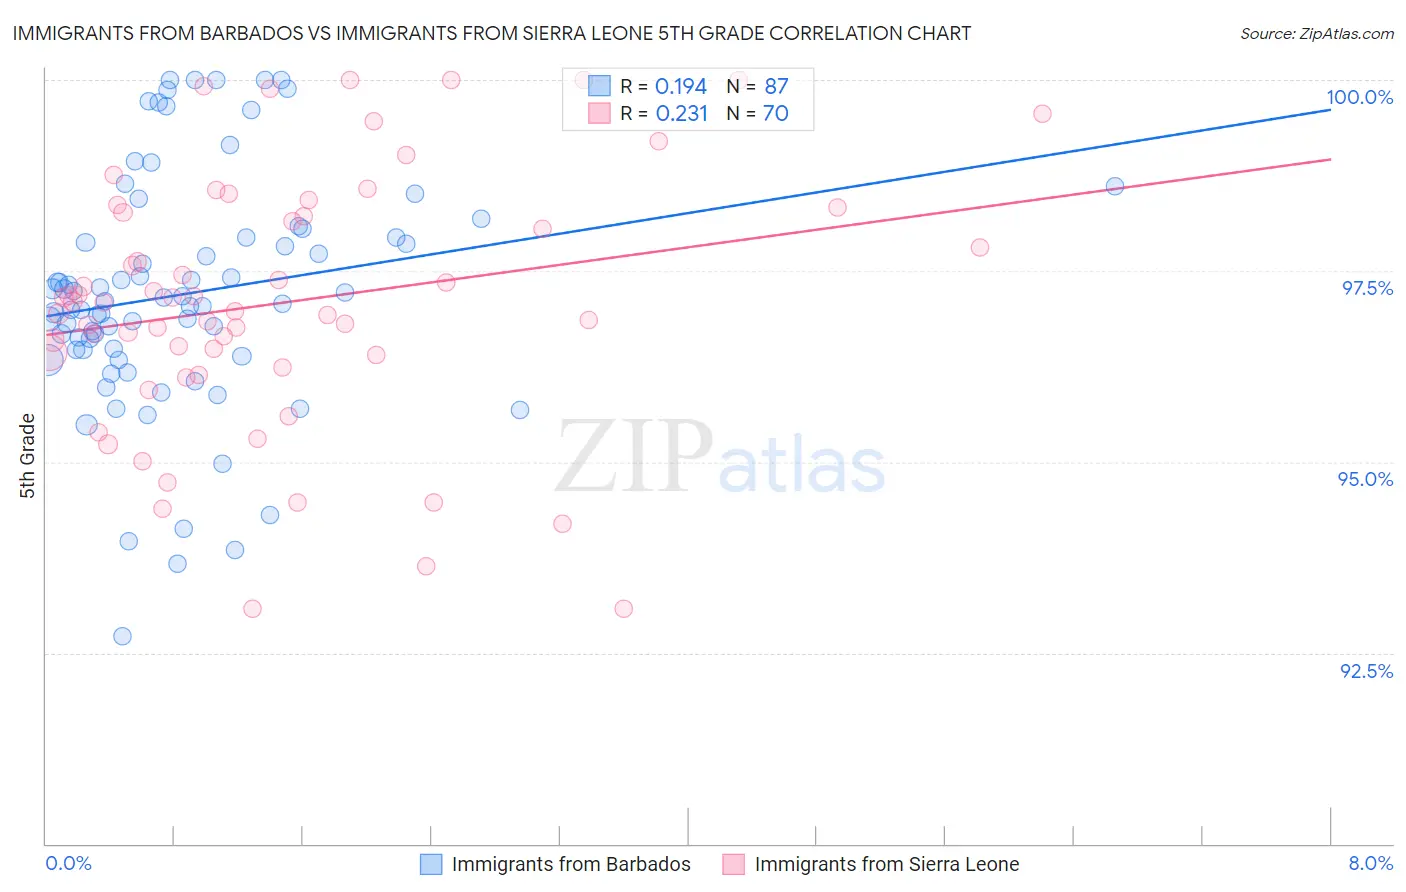
Immigrants from Barbados vs Immigrants from Sierra Leone 5th Grade Correlation Chart
The statistical analysis conducted on geographies consisting of 112,788,359 people shows a poor positive correlation between the proportion of Immigrants from Barbados and percentage of population with at least 5th grade education in the United States with a correlation coefficient (R) of 0.194 and weighted average of 96.6%. Similarly, the statistical analysis conducted on geographies consisting of 101,634,956 people shows a weak positive correlation between the proportion of Immigrants from Sierra Leone and percentage of population with at least 5th grade education in the United States with a correlation coefficient (R) of 0.231 and weighted average of 96.8%, a difference of 0.22%.
5th Grade Correlation Summary
| Measurement | Immigrants from Barbados | Immigrants from Sierra Leone |
| Minimum | 92.7% | 93.1% |
| Maximum | 100.0% | 100.0% |
| Range | 7.3% | 6.9% |
| Mean | 97.2% | 97.1% |
| Median | 97.1% | 97.1% |
| Interquartile 25% (IQ1) | 96.5% | 96.4% |
| Interquartile 75% (IQ3) | 97.9% | 98.3% |
| Interquartile Range (IQR) | 1.5% | 1.9% |
| Standard Deviation (Sample) | 1.5% | 1.7% |
| Standard Deviation (Population) | 1.5% | 1.7% |
Similar Demographics by 5th Grade
Demographics Similar to Immigrants from Barbados by 5th Grade
In terms of 5th grade, the demographic groups most similar to Immigrants from Barbados are Immigrants from Afghanistan (96.6%, a difference of 0.010%), Immigrants from Thailand (96.6%, a difference of 0.030%), Immigrants from St. Vincent and the Grenadines (96.6%, a difference of 0.040%), Immigrants from Trinidad and Tobago (96.6%, a difference of 0.050%), and Houma (96.6%, a difference of 0.060%).
| Demographics | Rating | Rank | 5th Grade |
| Houma | 0.1 /100 | #281 | Tragic 96.6% |
| Barbadians | 0.1 /100 | #282 | Tragic 96.6% |
| Fijians | 0.1 /100 | #283 | Tragic 96.6% |
| Immigrants | Trinidad and Tobago | 0.1 /100 | #284 | Tragic 96.6% |
| Immigrants | St. Vincent and the Grenadines | 0.1 /100 | #285 | Tragic 96.6% |
| Immigrants | Thailand | 0.1 /100 | #286 | Tragic 96.6% |
| Immigrants | Afghanistan | 0.1 /100 | #287 | Tragic 96.6% |
| Immigrants | Barbados | 0.0 /100 | #288 | Tragic 96.6% |
| Immigrants | West Indies | 0.0 /100 | #289 | Tragic 96.5% |
| British West Indians | 0.0 /100 | #290 | Tragic 96.5% |
| Malaysians | 0.0 /100 | #291 | Tragic 96.5% |
| Somalis | 0.0 /100 | #292 | Tragic 96.5% |
| Immigrants | Grenada | 0.0 /100 | #293 | Tragic 96.5% |
| Immigrants | Eritrea | 0.0 /100 | #294 | Tragic 96.4% |
| Immigrants | Somalia | 0.0 /100 | #295 | Tragic 96.4% |
Demographics Similar to Immigrants from Sierra Leone by 5th Grade
In terms of 5th grade, the demographic groups most similar to Immigrants from Sierra Leone are Immigrants from Jamaica (96.8%, a difference of 0.0%), Immigrants from Colombia (96.8%, a difference of 0.0%), Immigrants from Uzbekistan (96.8%, a difference of 0.010%), Immigrants from Ethiopia (96.8%, a difference of 0.020%), and Immigrants from China (96.8%, a difference of 0.020%).
| Demographics | Rating | Rank | 5th Grade |
| Immigrants | Senegal | 0.8 /100 | #254 | Tragic 96.8% |
| South Americans | 0.7 /100 | #255 | Tragic 96.8% |
| Immigrants | Congo | 0.7 /100 | #256 | Tragic 96.8% |
| Peruvians | 0.6 /100 | #257 | Tragic 96.8% |
| Immigrants | Ethiopia | 0.5 /100 | #258 | Tragic 96.8% |
| Immigrants | China | 0.5 /100 | #259 | Tragic 96.8% |
| Immigrants | Jamaica | 0.4 /100 | #260 | Tragic 96.8% |
| Immigrants | Sierra Leone | 0.4 /100 | #261 | Tragic 96.8% |
| Immigrants | Colombia | 0.4 /100 | #262 | Tragic 96.8% |
| Immigrants | Uzbekistan | 0.3 /100 | #263 | Tragic 96.8% |
| West Indians | 0.3 /100 | #264 | Tragic 96.8% |
| Taiwanese | 0.3 /100 | #265 | Tragic 96.7% |
| Immigrants | Nigeria | 0.3 /100 | #266 | Tragic 96.7% |
| Immigrants | South America | 0.3 /100 | #267 | Tragic 96.7% |
| Armenians | 0.3 /100 | #268 | Tragic 96.7% |