Immigrants from Eastern Africa vs Bangladeshi Professional Degree
COMPARE
Immigrants from Eastern Africa
Bangladeshi
Professional Degree
Professional Degree Comparison
Immigrants from Eastern Africa
Bangladeshis
4.8%
PROFESSIONAL DEGREE
92.5/ 100
METRIC RATING
128th/ 347
METRIC RANK
3.1%
PROFESSIONAL DEGREE
0.0/ 100
METRIC RATING
329th/ 347
METRIC RANK
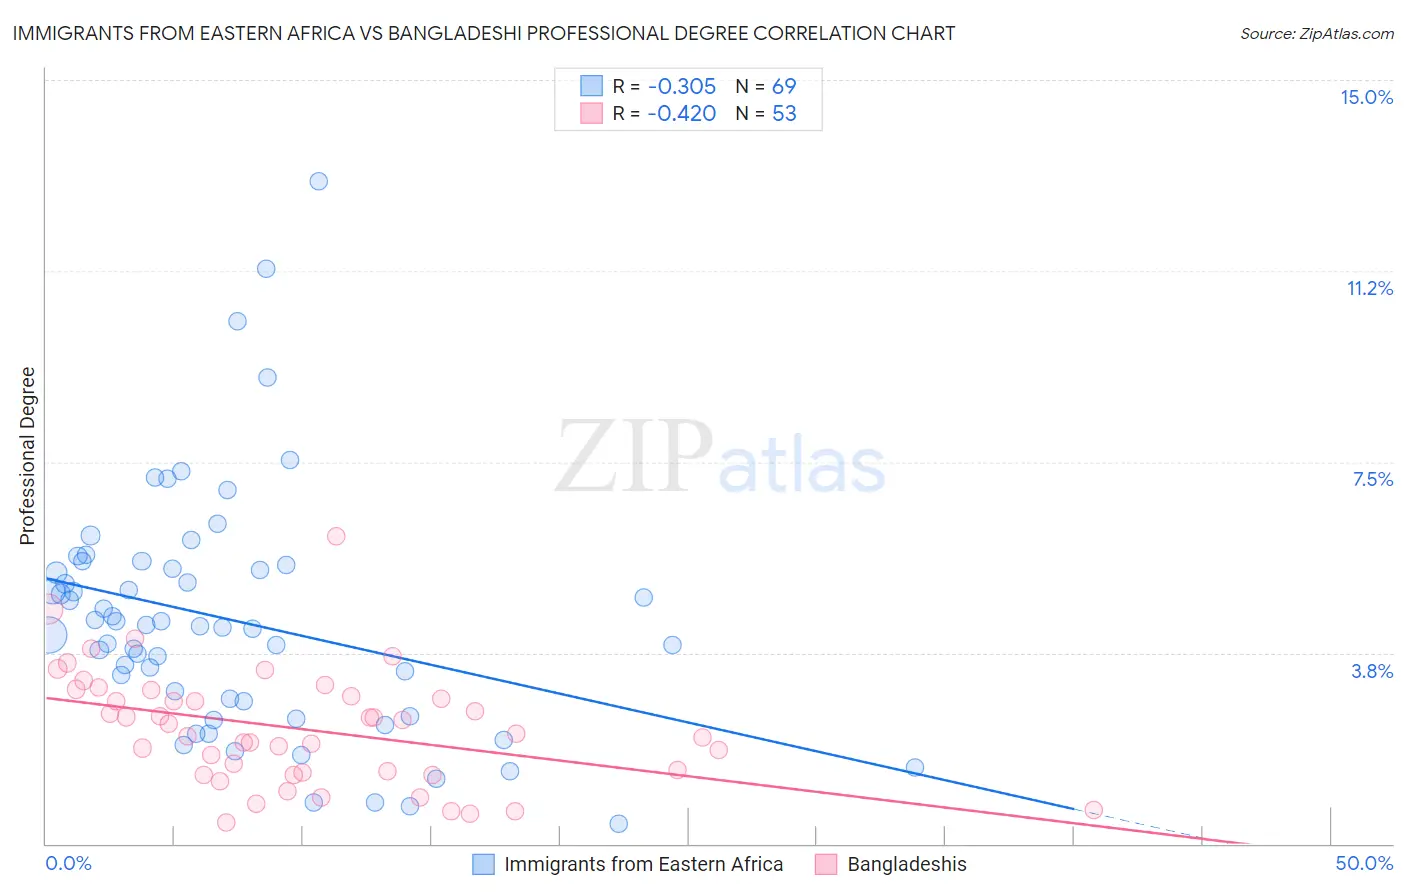
Immigrants from Eastern Africa vs Bangladeshi Professional Degree Correlation Chart
The statistical analysis conducted on geographies consisting of 354,533,484 people shows a mild negative correlation between the proportion of Immigrants from Eastern Africa and percentage of population with at least professional degree education in the United States with a correlation coefficient (R) of -0.305 and weighted average of 4.8%. Similarly, the statistical analysis conducted on geographies consisting of 141,225,031 people shows a moderate negative correlation between the proportion of Bangladeshis and percentage of population with at least professional degree education in the United States with a correlation coefficient (R) of -0.420 and weighted average of 3.1%, a difference of 55.7%.
Professional Degree Correlation Summary
| Measurement | Immigrants from Eastern Africa | Bangladeshi |
| Minimum | 0.40% | 0.42% |
| Maximum | 13.0% | 6.0% |
| Range | 12.6% | 5.6% |
| Mean | 4.4% | 2.3% |
| Median | 4.3% | 2.2% |
| Interquartile 25% (IQ1) | 2.7% | 1.4% |
| Interquartile 75% (IQ3) | 5.4% | 3.0% |
| Interquartile Range (IQR) | 2.8% | 1.6% |
| Standard Deviation (Sample) | 2.4% | 1.1% |
| Standard Deviation (Population) | 2.4% | 1.1% |
Similar Demographics by Professional Degree
Demographics Similar to Immigrants from Eastern Africa by Professional Degree
In terms of professional degree, the demographic groups most similar to Immigrants from Eastern Africa are Serbian (4.8%, a difference of 0.020%), European (4.8%, a difference of 0.32%), Immigrants from Albania (4.8%, a difference of 0.37%), Palestinian (4.8%, a difference of 0.46%), and Icelander (4.8%, a difference of 0.48%).
| Demographics | Rating | Rank | Professional Degree |
| Immigrants | Moldova | 94.8 /100 | #121 | Exceptional 4.9% |
| Immigrants | Germany | 94.1 /100 | #122 | Exceptional 4.9% |
| Immigrants | Venezuela | 93.8 /100 | #123 | Exceptional 4.8% |
| Immigrants | Eritrea | 93.5 /100 | #124 | Exceptional 4.8% |
| Immigrants | Albania | 93.3 /100 | #125 | Exceptional 4.8% |
| Europeans | 93.2 /100 | #126 | Exceptional 4.8% |
| Serbians | 92.6 /100 | #127 | Exceptional 4.8% |
| Immigrants | Eastern Africa | 92.5 /100 | #128 | Exceptional 4.8% |
| Palestinians | 91.5 /100 | #129 | Exceptional 4.8% |
| Icelanders | 91.5 /100 | #130 | Exceptional 4.8% |
| Immigrants | Nepal | 91.4 /100 | #131 | Exceptional 4.8% |
| Pakistanis | 90.9 /100 | #132 | Exceptional 4.8% |
| Italians | 90.2 /100 | #133 | Exceptional 4.8% |
| South American Indians | 89.9 /100 | #134 | Excellent 4.8% |
| Macedonians | 89.8 /100 | #135 | Excellent 4.8% |
Demographics Similar to Bangladeshis by Professional Degree
In terms of professional degree, the demographic groups most similar to Bangladeshis are Immigrants from Cabo Verde (3.1%, a difference of 0.080%), Kiowa (3.1%, a difference of 0.20%), Creek (3.1%, a difference of 0.21%), Dutch West Indian (3.1%, a difference of 0.27%), and Yakama (3.1%, a difference of 0.31%).
| Demographics | Rating | Rank | Professional Degree |
| Hispanics or Latinos | 0.0 /100 | #322 | Tragic 3.2% |
| Inupiat | 0.0 /100 | #323 | Tragic 3.2% |
| Crow | 0.0 /100 | #324 | Tragic 3.2% |
| Yaqui | 0.0 /100 | #325 | Tragic 3.2% |
| Menominee | 0.0 /100 | #326 | Tragic 3.1% |
| Dutch West Indians | 0.0 /100 | #327 | Tragic 3.1% |
| Creek | 0.0 /100 | #328 | Tragic 3.1% |
| Bangladeshis | 0.0 /100 | #329 | Tragic 3.1% |
| Immigrants | Cabo Verde | 0.0 /100 | #330 | Tragic 3.1% |
| Kiowa | 0.0 /100 | #331 | Tragic 3.1% |
| Yakama | 0.0 /100 | #332 | Tragic 3.1% |
| Puget Sound Salish | 0.0 /100 | #333 | Tragic 3.1% |
| Pennsylvania Germans | 0.0 /100 | #334 | Tragic 3.0% |
| Natives/Alaskans | 0.0 /100 | #335 | Tragic 3.0% |
| Fijians | 0.0 /100 | #336 | Tragic 2.9% |