Immigrants from Dominican Republic vs Immigrants from Liberia 2nd Grade
COMPARE
Immigrants from Dominican Republic
Immigrants from Liberia
2nd Grade
2nd Grade Comparison
Immigrants from Dominican Republic
Immigrants from Liberia
96.4%
2ND GRADE
0.0/ 100
METRIC RATING
333rd/ 347
METRIC RANK
97.4%
2ND GRADE
0.4/ 100
METRIC RATING
264th/ 347
METRIC RANK
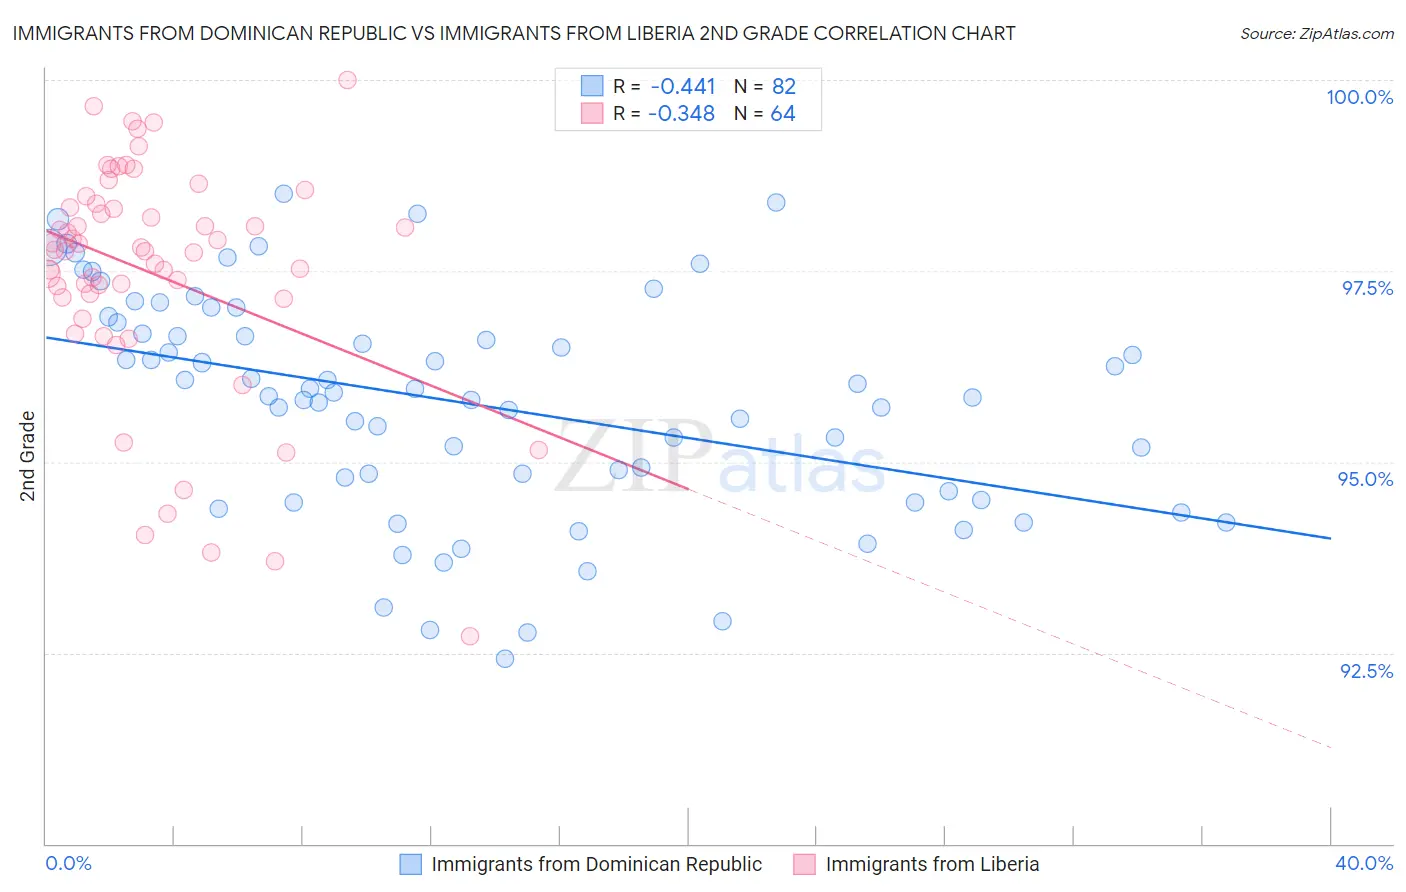
Immigrants from Dominican Republic vs Immigrants from Liberia 2nd Grade Correlation Chart
The statistical analysis conducted on geographies consisting of 275,142,551 people shows a moderate negative correlation between the proportion of Immigrants from Dominican Republic and percentage of population with at least 2nd grade education in the United States with a correlation coefficient (R) of -0.441 and weighted average of 96.4%. Similarly, the statistical analysis conducted on geographies consisting of 135,294,272 people shows a mild negative correlation between the proportion of Immigrants from Liberia and percentage of population with at least 2nd grade education in the United States with a correlation coefficient (R) of -0.348 and weighted average of 97.4%, a difference of 1.1%.
2nd Grade Correlation Summary
| Measurement | Immigrants from Dominican Republic | Immigrants from Liberia |
| Minimum | 92.4% | 92.7% |
| Maximum | 98.5% | 100.0% |
| Range | 6.1% | 7.3% |
| Mean | 95.8% | 97.5% |
| Median | 95.9% | 97.8% |
| Interquartile 25% (IQ1) | 94.6% | 97.1% |
| Interquartile 75% (IQ3) | 96.8% | 98.4% |
| Interquartile Range (IQR) | 2.2% | 1.2% |
| Standard Deviation (Sample) | 1.5% | 1.5% |
| Standard Deviation (Population) | 1.4% | 1.5% |
Similar Demographics by 2nd Grade
Demographics Similar to Immigrants from Dominican Republic by 2nd Grade
In terms of 2nd grade, the demographic groups most similar to Immigrants from Dominican Republic are Central American (96.4%, a difference of 0.020%), Yakama (96.4%, a difference of 0.030%), Immigrants from Fiji (96.4%, a difference of 0.040%), Immigrants from Cambodia (96.4%, a difference of 0.050%), and Bangladeshi (96.5%, a difference of 0.060%).
| Demographics | Rating | Rank | 2nd Grade |
| Immigrants | Honduras | 0.0 /100 | #326 | Tragic 96.6% |
| Immigrants | Vietnam | 0.0 /100 | #327 | Tragic 96.5% |
| Mexicans | 0.0 /100 | #328 | Tragic 96.5% |
| Japanese | 0.0 /100 | #329 | Tragic 96.5% |
| Immigrants | Latin America | 0.0 /100 | #330 | Tragic 96.5% |
| Immigrants | Armenia | 0.0 /100 | #331 | Tragic 96.5% |
| Bangladeshis | 0.0 /100 | #332 | Tragic 96.5% |
| Immigrants | Dominican Republic | 0.0 /100 | #333 | Tragic 96.4% |
| Central Americans | 0.0 /100 | #334 | Tragic 96.4% |
| Yakama | 0.0 /100 | #335 | Tragic 96.4% |
| Immigrants | Fiji | 0.0 /100 | #336 | Tragic 96.4% |
| Immigrants | Cambodia | 0.0 /100 | #337 | Tragic 96.4% |
| Immigrants | Cabo Verde | 0.0 /100 | #338 | Tragic 96.3% |
| Guatemalans | 0.0 /100 | #339 | Tragic 96.3% |
| Immigrants | Guatemala | 0.0 /100 | #340 | Tragic 96.2% |
Demographics Similar to Immigrants from Liberia by 2nd Grade
In terms of 2nd grade, the demographic groups most similar to Immigrants from Liberia are Taiwanese (97.4%, a difference of 0.0%), Immigrants from Ethiopia (97.4%, a difference of 0.0%), Immigrants from South America (97.4%, a difference of 0.0%), Immigrants from Sierra Leone (97.4%, a difference of 0.0%), and Yaqui (97.5%, a difference of 0.020%).
| Demographics | Rating | Rank | 2nd Grade |
| Immigrants | Colombia | 0.5 /100 | #257 | Tragic 97.5% |
| Yaqui | 0.5 /100 | #258 | Tragic 97.5% |
| Fijians | 0.5 /100 | #259 | Tragic 97.5% |
| Assyrians/Chaldeans/Syriacs | 0.5 /100 | #260 | Tragic 97.5% |
| Armenians | 0.5 /100 | #261 | Tragic 97.5% |
| Taiwanese | 0.4 /100 | #262 | Tragic 97.4% |
| Immigrants | Ethiopia | 0.4 /100 | #263 | Tragic 97.4% |
| Immigrants | Liberia | 0.4 /100 | #264 | Tragic 97.4% |
| Immigrants | South America | 0.4 /100 | #265 | Tragic 97.4% |
| Immigrants | Sierra Leone | 0.4 /100 | #266 | Tragic 97.4% |
| Cubans | 0.3 /100 | #267 | Tragic 97.4% |
| Immigrants | Nigeria | 0.3 /100 | #268 | Tragic 97.4% |
| West Indians | 0.3 /100 | #269 | Tragic 97.4% |
| Immigrants | Jamaica | 0.2 /100 | #270 | Tragic 97.4% |
| Immigrants | Cameroon | 0.2 /100 | #271 | Tragic 97.4% |