Immigrants from Czechoslovakia vs South African High School Diploma
COMPARE
Immigrants from Czechoslovakia
South African
High School Diploma
High School Diploma Comparison
Immigrants from Czechoslovakia
South Africans
90.9%
HIGH SCHOOL DIPLOMA
99.4/ 100
METRIC RATING
74th/ 347
METRIC RANK
90.6%
HIGH SCHOOL DIPLOMA
98.6/ 100
METRIC RATING
91st/ 347
METRIC RANK
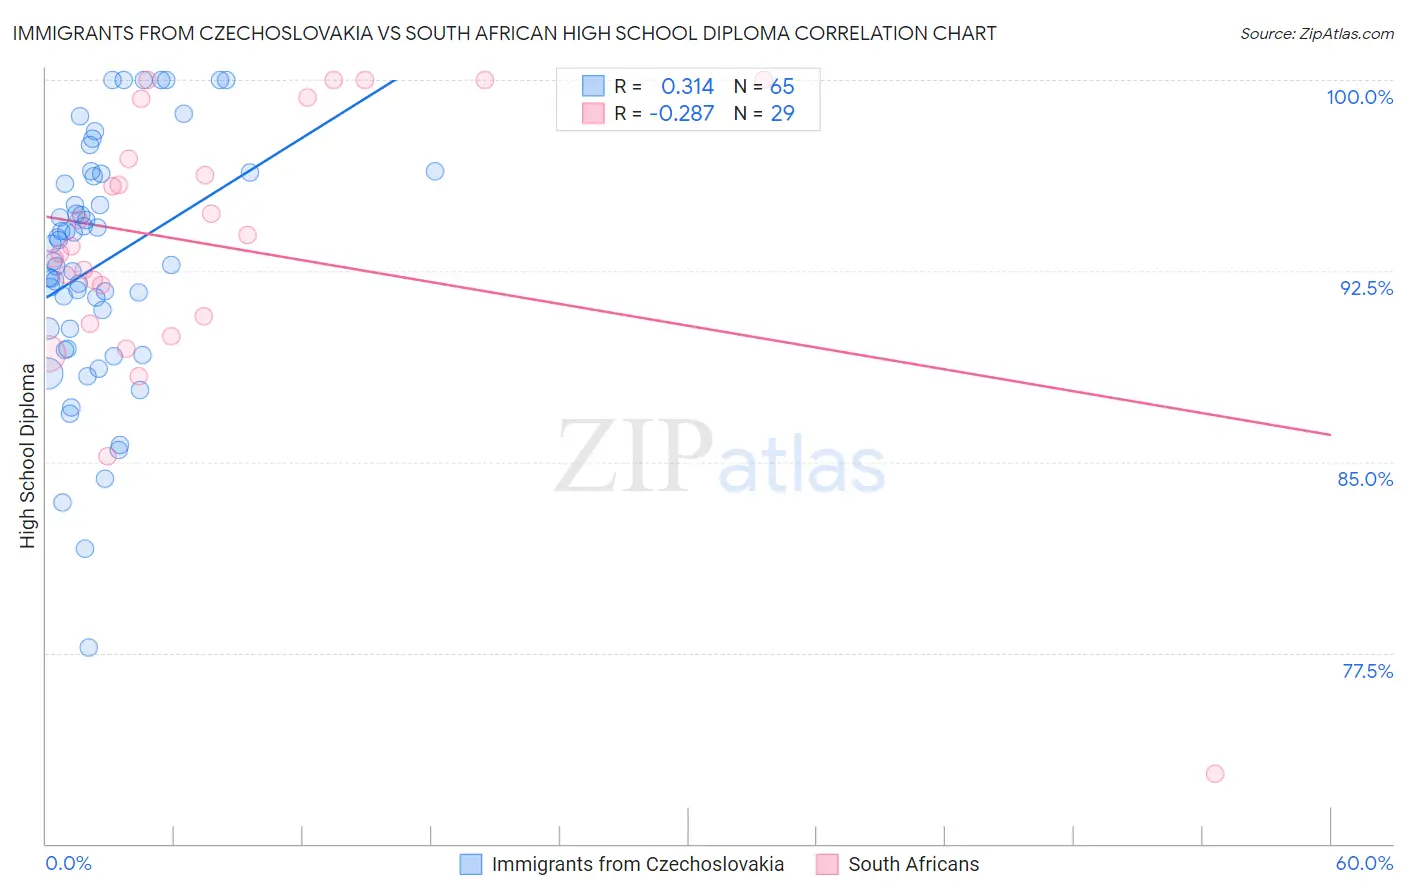
Immigrants from Czechoslovakia vs South African High School Diploma Correlation Chart
The statistical analysis conducted on geographies consisting of 195,448,106 people shows a mild positive correlation between the proportion of Immigrants from Czechoslovakia and percentage of population with at least high school diploma education in the United States with a correlation coefficient (R) of 0.314 and weighted average of 90.9%. Similarly, the statistical analysis conducted on geographies consisting of 182,604,532 people shows a weak negative correlation between the proportion of South Africans and percentage of population with at least high school diploma education in the United States with a correlation coefficient (R) of -0.287 and weighted average of 90.6%, a difference of 0.30%.
High School Diploma Correlation Summary
| Measurement | Immigrants from Czechoslovakia | South African |
| Minimum | 77.7% | 72.7% |
| Maximum | 100.0% | 100.0% |
| Range | 22.3% | 27.3% |
| Mean | 92.8% | 93.5% |
| Median | 92.9% | 93.5% |
| Interquartile 25% (IQ1) | 89.8% | 90.6% |
| Interquartile 75% (IQ3) | 96.3% | 98.1% |
| Interquartile Range (IQR) | 6.4% | 7.5% |
| Standard Deviation (Sample) | 4.8% | 5.7% |
| Standard Deviation (Population) | 4.7% | 5.6% |
Demographics Similar to Immigrants from Czechoslovakia and South Africans by High School Diploma
In terms of high school diploma, the demographic groups most similar to Immigrants from Czechoslovakia are Immigrants from South Central Asia (90.9%, a difference of 0.010%), Cambodian (90.8%, a difference of 0.020%), Hungarian (90.8%, a difference of 0.030%), Soviet Union (90.9%, a difference of 0.040%), and Native Hawaiian (90.8%, a difference of 0.040%). Similarly, the demographic groups most similar to South Africans are Swiss (90.6%, a difference of 0.010%), Celtic (90.6%, a difference of 0.020%), Canadian (90.6%, a difference of 0.030%), Immigrants from France (90.6%, a difference of 0.050%), and Immigrants from Bulgaria (90.6%, a difference of 0.070%).
| Demographics | Rating | Rank | High School Diploma |
| Soviet Union | 99.4 /100 | #72 | Exceptional 90.9% |
| Immigrants | South Central Asia | 99.4 /100 | #73 | Exceptional 90.9% |
| Immigrants | Czechoslovakia | 99.4 /100 | #74 | Exceptional 90.9% |
| Cambodians | 99.4 /100 | #75 | Exceptional 90.8% |
| Hungarians | 99.3 /100 | #76 | Exceptional 90.8% |
| Native Hawaiians | 99.3 /100 | #77 | Exceptional 90.8% |
| Burmese | 99.3 /100 | #78 | Exceptional 90.8% |
| Immigrants | Denmark | 99.3 /100 | #79 | Exceptional 90.8% |
| Immigrants | England | 99.3 /100 | #80 | Exceptional 90.8% |
| Immigrants | Switzerland | 99.3 /100 | #81 | Exceptional 90.8% |
| Scotch-Irish | 99.2 /100 | #82 | Exceptional 90.8% |
| Immigrants | Moldova | 99.2 /100 | #83 | Exceptional 90.7% |
| Immigrants | Saudi Arabia | 99.1 /100 | #84 | Exceptional 90.7% |
| Romanians | 98.9 /100 | #85 | Exceptional 90.7% |
| Immigrants | Bulgaria | 98.9 /100 | #86 | Exceptional 90.6% |
| Immigrants | Turkey | 98.9 /100 | #87 | Exceptional 90.6% |
| Immigrants | France | 98.8 /100 | #88 | Exceptional 90.6% |
| Canadians | 98.7 /100 | #89 | Exceptional 90.6% |
| Celtics | 98.7 /100 | #90 | Exceptional 90.6% |
| South Africans | 98.6 /100 | #91 | Exceptional 90.6% |
| Swiss | 98.6 /100 | #92 | Exceptional 90.6% |