Immigrants from Czechoslovakia vs Armenian Female Disability
COMPARE
Immigrants from Czechoslovakia
Armenian
Female Disability
Female Disability Comparison
Immigrants from Czechoslovakia
Armenians
11.6%
FEMALE DISABILITY
99.5/ 100
METRIC RATING
92nd/ 347
METRIC RANK
12.3%
FEMALE DISABILITY
29.7/ 100
METRIC RATING
191st/ 347
METRIC RANK
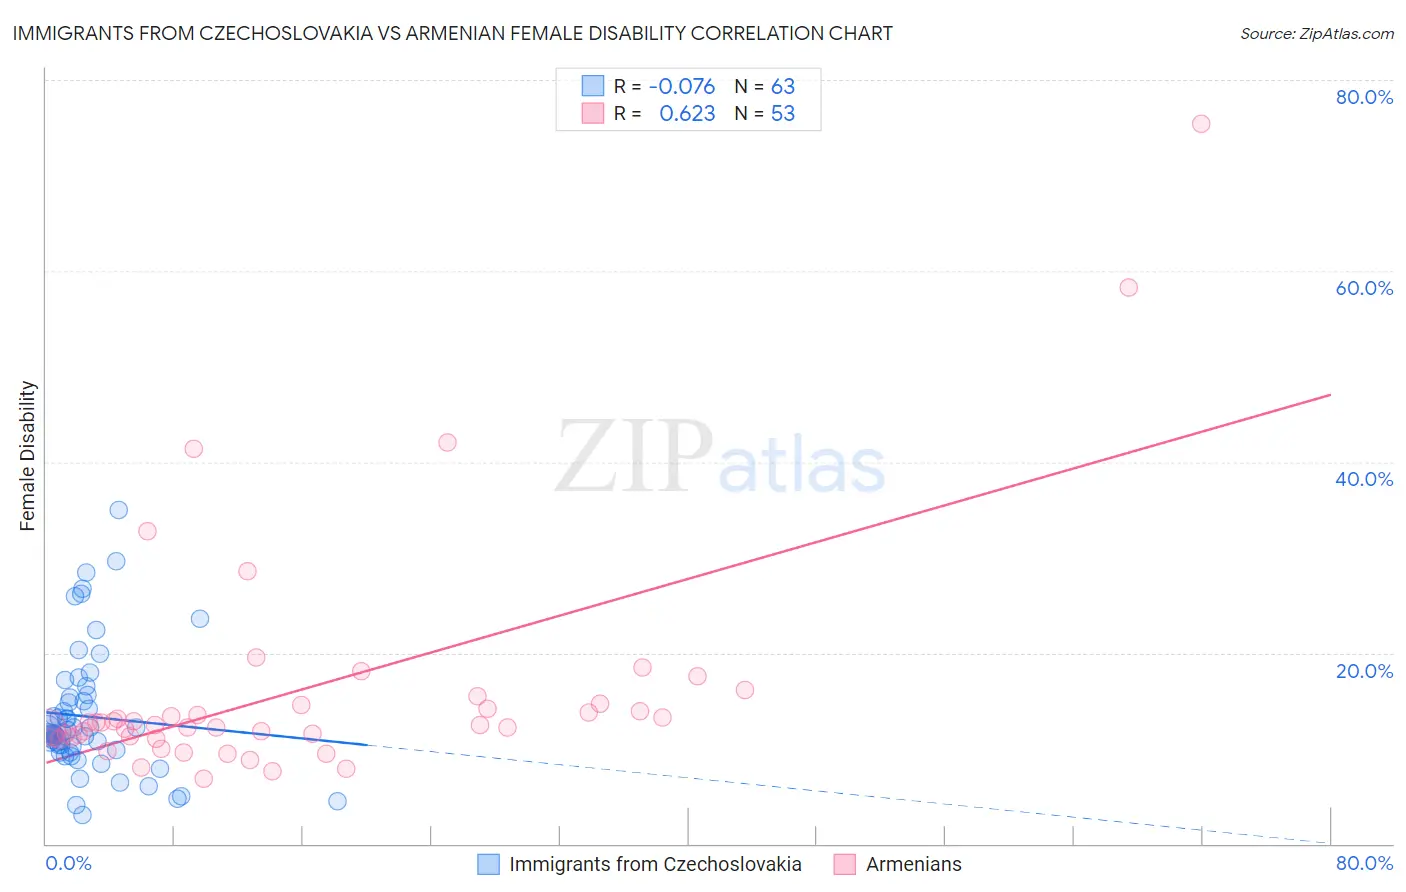
Immigrants from Czechoslovakia vs Armenian Female Disability Correlation Chart
The statistical analysis conducted on geographies consisting of 195,453,586 people shows a slight negative correlation between the proportion of Immigrants from Czechoslovakia and percentage of females with a disability in the United States with a correlation coefficient (R) of -0.076 and weighted average of 11.6%. Similarly, the statistical analysis conducted on geographies consisting of 310,925,320 people shows a significant positive correlation between the proportion of Armenians and percentage of females with a disability in the United States with a correlation coefficient (R) of 0.623 and weighted average of 12.3%, a difference of 6.1%.
Female Disability Correlation Summary
| Measurement | Immigrants from Czechoslovakia | Armenian |
| Minimum | 3.1% | 6.9% |
| Maximum | 34.9% | 75.4% |
| Range | 31.8% | 68.5% |
| Mean | 13.3% | 16.2% |
| Median | 11.6% | 12.5% |
| Interquartile 25% (IQ1) | 9.8% | 11.2% |
| Interquartile 75% (IQ3) | 15.3% | 14.6% |
| Interquartile Range (IQR) | 5.5% | 3.4% |
| Standard Deviation (Sample) | 6.5% | 12.4% |
| Standard Deviation (Population) | 6.5% | 12.3% |
Similar Demographics by Female Disability
Demographics Similar to Immigrants from Czechoslovakia by Female Disability
In terms of female disability, the demographic groups most similar to Immigrants from Czechoslovakia are Immigrants from Romania (11.6%, a difference of 0.010%), Immigrants from Zimbabwe (11.6%, a difference of 0.010%), Vietnamese (11.6%, a difference of 0.020%), Immigrants from Sierra Leone (11.6%, a difference of 0.10%), and Immigrants from Denmark (11.6%, a difference of 0.12%).
| Demographics | Rating | Rank | Female Disability |
| Palestinians | 99.6 /100 | #85 | Exceptional 11.6% |
| Immigrants | Cameroon | 99.6 /100 | #86 | Exceptional 11.6% |
| Immigrants | Denmark | 99.5 /100 | #87 | Exceptional 11.6% |
| Yup'ik | 99.5 /100 | #88 | Exceptional 11.6% |
| Vietnamese | 99.5 /100 | #89 | Exceptional 11.6% |
| Immigrants | Romania | 99.5 /100 | #90 | Exceptional 11.6% |
| Immigrants | Zimbabwe | 99.5 /100 | #91 | Exceptional 11.6% |
| Immigrants | Czechoslovakia | 99.5 /100 | #92 | Exceptional 11.6% |
| Immigrants | Sierra Leone | 99.4 /100 | #93 | Exceptional 11.6% |
| Immigrants | Brazil | 99.4 /100 | #94 | Exceptional 11.6% |
| Immigrants | Northern Europe | 99.4 /100 | #95 | Exceptional 11.6% |
| Immigrants | Russia | 99.0 /100 | #96 | Exceptional 11.7% |
| Koreans | 99.0 /100 | #97 | Exceptional 11.7% |
| Uruguayans | 98.8 /100 | #98 | Exceptional 11.7% |
| Immigrants | Philippines | 98.6 /100 | #99 | Exceptional 11.7% |
Demographics Similar to Armenians by Female Disability
In terms of female disability, the demographic groups most similar to Armenians are Immigrants from Western Africa (12.3%, a difference of 0.020%), Immigrants from Honduras (12.3%, a difference of 0.070%), Immigrants from Albania (12.3%, a difference of 0.080%), Northern European (12.3%, a difference of 0.10%), and Ukrainian (12.3%, a difference of 0.11%).
| Demographics | Rating | Rank | Female Disability |
| Iraqis | 36.0 /100 | #184 | Fair 12.3% |
| Immigrants | Uzbekistan | 33.9 /100 | #185 | Fair 12.3% |
| Austrians | 33.3 /100 | #186 | Fair 12.3% |
| Serbians | 33.1 /100 | #187 | Fair 12.3% |
| Immigrants | North America | 32.8 /100 | #188 | Fair 12.3% |
| Immigrants | Albania | 31.6 /100 | #189 | Fair 12.3% |
| Immigrants | Honduras | 31.3 /100 | #190 | Fair 12.3% |
| Armenians | 29.7 /100 | #191 | Fair 12.3% |
| Immigrants | Western Africa | 29.2 /100 | #192 | Fair 12.3% |
| Northern Europeans | 27.5 /100 | #193 | Fair 12.3% |
| Ukrainians | 27.2 /100 | #194 | Fair 12.3% |
| Swedes | 26.6 /100 | #195 | Fair 12.3% |
| Immigrants | Panama | 25.5 /100 | #196 | Fair 12.3% |
| Hondurans | 25.4 /100 | #197 | Fair 12.3% |
| Mexican American Indians | 24.9 /100 | #198 | Fair 12.3% |