Immigrants from Cuba vs Lithuanian 3rd Grade
COMPARE
Immigrants from Cuba
Lithuanian
3rd Grade
3rd Grade Comparison
Immigrants from Cuba
Lithuanians
96.8%
3RD GRADE
0.0/ 100
METRIC RATING
301st/ 347
METRIC RANK
98.5%
3RD GRADE
100.0/ 100
METRIC RATING
21st/ 347
METRIC RANK
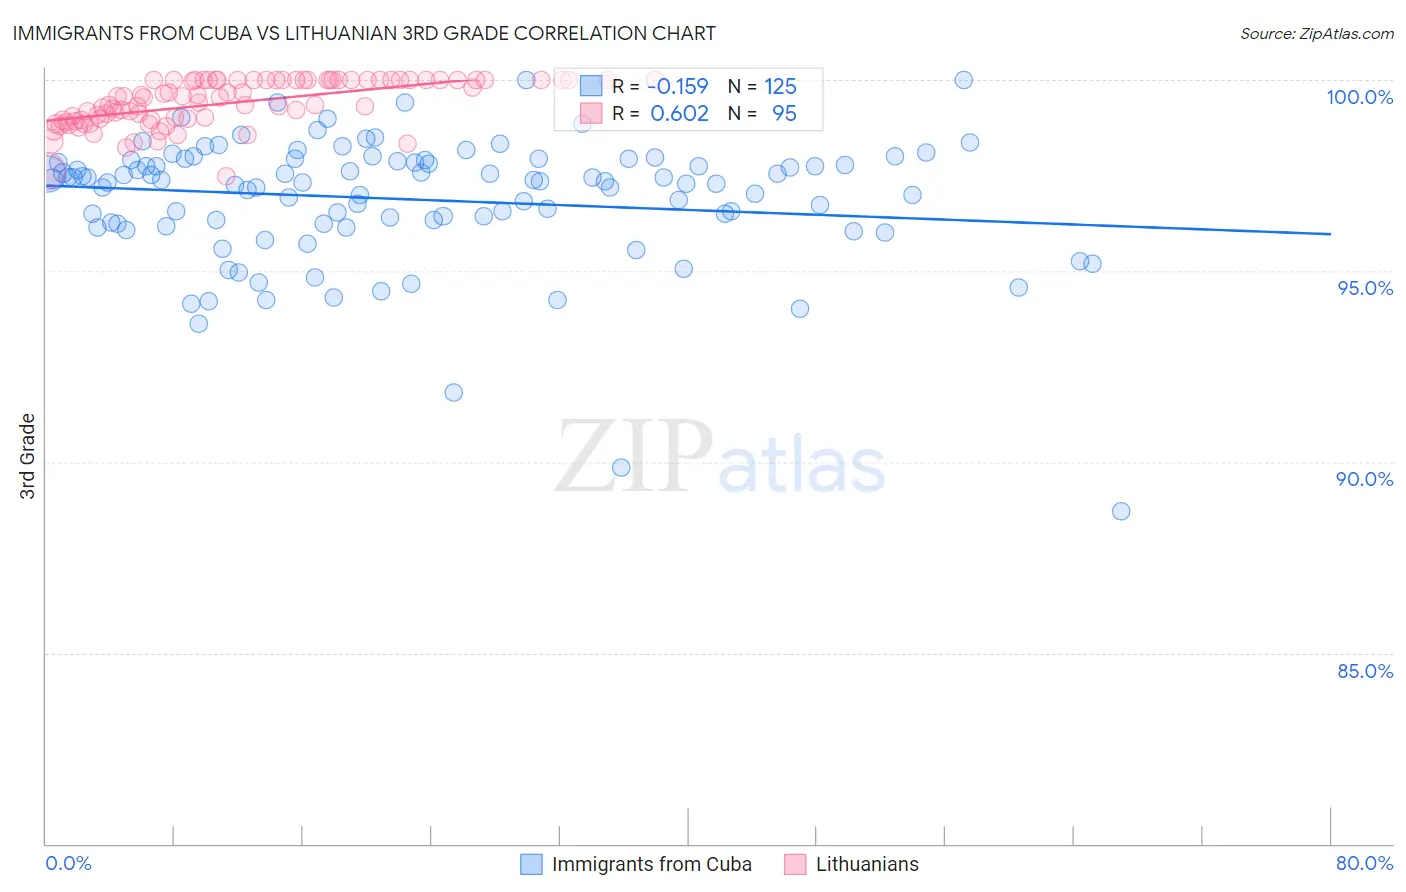
Immigrants from Cuba vs Lithuanian 3rd Grade Correlation Chart
The statistical analysis conducted on geographies consisting of 326,028,159 people shows a poor negative correlation between the proportion of Immigrants from Cuba and percentage of population with at least 3rd grade education in the United States with a correlation coefficient (R) of -0.159 and weighted average of 96.8%. Similarly, the statistical analysis conducted on geographies consisting of 421,946,231 people shows a significant positive correlation between the proportion of Lithuanians and percentage of population with at least 3rd grade education in the United States with a correlation coefficient (R) of 0.602 and weighted average of 98.5%, a difference of 1.7%.
3rd Grade Correlation Summary
| Measurement | Immigrants from Cuba | Lithuanian |
| Minimum | 88.7% | 97.5% |
| Maximum | 100.0% | 100.0% |
| Range | 11.3% | 2.5% |
| Mean | 96.9% | 99.4% |
| Median | 97.3% | 99.5% |
| Interquartile 25% (IQ1) | 96.2% | 99.0% |
| Interquartile 75% (IQ3) | 97.9% | 100.0% |
| Interquartile Range (IQR) | 1.6% | 1.0% |
| Standard Deviation (Sample) | 1.7% | 0.60% |
| Standard Deviation (Population) | 1.7% | 0.60% |
Similar Demographics by 3rd Grade
Demographics Similar to Immigrants from Cuba by 3rd Grade
In terms of 3rd grade, the demographic groups most similar to Immigrants from Cuba are Immigrants from South Eastern Asia (96.8%, a difference of 0.010%), Somali (96.8%, a difference of 0.020%), Haitian (96.9%, a difference of 0.030%), Immigrants from Dominica (96.9%, a difference of 0.030%), and Immigrants (96.9%, a difference of 0.050%).
| Demographics | Rating | Rank | 3rd Grade |
| Malaysians | 0.0 /100 | #294 | Tragic 97.0% |
| Immigrants | Eritrea | 0.0 /100 | #295 | Tragic 97.0% |
| Immigrants | Immigrants | 0.0 /100 | #296 | Tragic 96.9% |
| Haitians | 0.0 /100 | #297 | Tragic 96.9% |
| Immigrants | Dominica | 0.0 /100 | #298 | Tragic 96.9% |
| Somalis | 0.0 /100 | #299 | Tragic 96.8% |
| Immigrants | South Eastern Asia | 0.0 /100 | #300 | Tragic 96.8% |
| Immigrants | Cuba | 0.0 /100 | #301 | Tragic 96.8% |
| Immigrants | Somalia | 0.0 /100 | #302 | Tragic 96.8% |
| Ecuadorians | 0.0 /100 | #303 | Tragic 96.7% |
| Immigrants | Caribbean | 0.0 /100 | #304 | Tragic 96.7% |
| Central American Indians | 0.0 /100 | #305 | Tragic 96.7% |
| Guyanese | 0.0 /100 | #306 | Tragic 96.7% |
| Nicaraguans | 0.0 /100 | #307 | Tragic 96.7% |
| Immigrants | Haiti | 0.0 /100 | #308 | Tragic 96.7% |
Demographics Similar to Lithuanians by 3rd Grade
In terms of 3rd grade, the demographic groups most similar to Lithuanians are Pennsylvania German (98.5%, a difference of 0.0%), Finnish (98.5%, a difference of 0.0%), Sioux (98.5%, a difference of 0.0%), Irish (98.5%, a difference of 0.010%), and Polish (98.5%, a difference of 0.010%).
| Demographics | Rating | Rank | 3rd Grade |
| Carpatho Rusyns | 100.0 /100 | #14 | Exceptional 98.5% |
| Swedes | 100.0 /100 | #15 | Exceptional 98.5% |
| Scottish | 100.0 /100 | #16 | Exceptional 98.5% |
| Dutch | 100.0 /100 | #17 | Exceptional 98.5% |
| Irish | 100.0 /100 | #18 | Exceptional 98.5% |
| Poles | 100.0 /100 | #19 | Exceptional 98.5% |
| Pennsylvania Germans | 100.0 /100 | #20 | Exceptional 98.5% |
| Lithuanians | 100.0 /100 | #21 | Exceptional 98.5% |
| Finns | 100.0 /100 | #22 | Exceptional 98.5% |
| Sioux | 100.0 /100 | #23 | Exceptional 98.5% |
| Danes | 100.0 /100 | #24 | Exceptional 98.5% |
| Scotch-Irish | 100.0 /100 | #25 | Exceptional 98.5% |
| Aleuts | 100.0 /100 | #26 | Exceptional 98.5% |
| Croatians | 100.0 /100 | #27 | Exceptional 98.5% |
| French | 100.0 /100 | #28 | Exceptional 98.4% |