Immigrants from Cuba vs Trinidadian and Tobagonian 3rd Grade
COMPARE
Immigrants from Cuba
Trinidadian and Tobagonian
3rd Grade
3rd Grade Comparison
Immigrants from Cuba
Trinidadians and Tobagonians
96.8%
3RD GRADE
0.0/ 100
METRIC RATING
301st/ 347
METRIC RANK
97.2%
3RD GRADE
0.1/ 100
METRIC RATING
277th/ 347
METRIC RANK
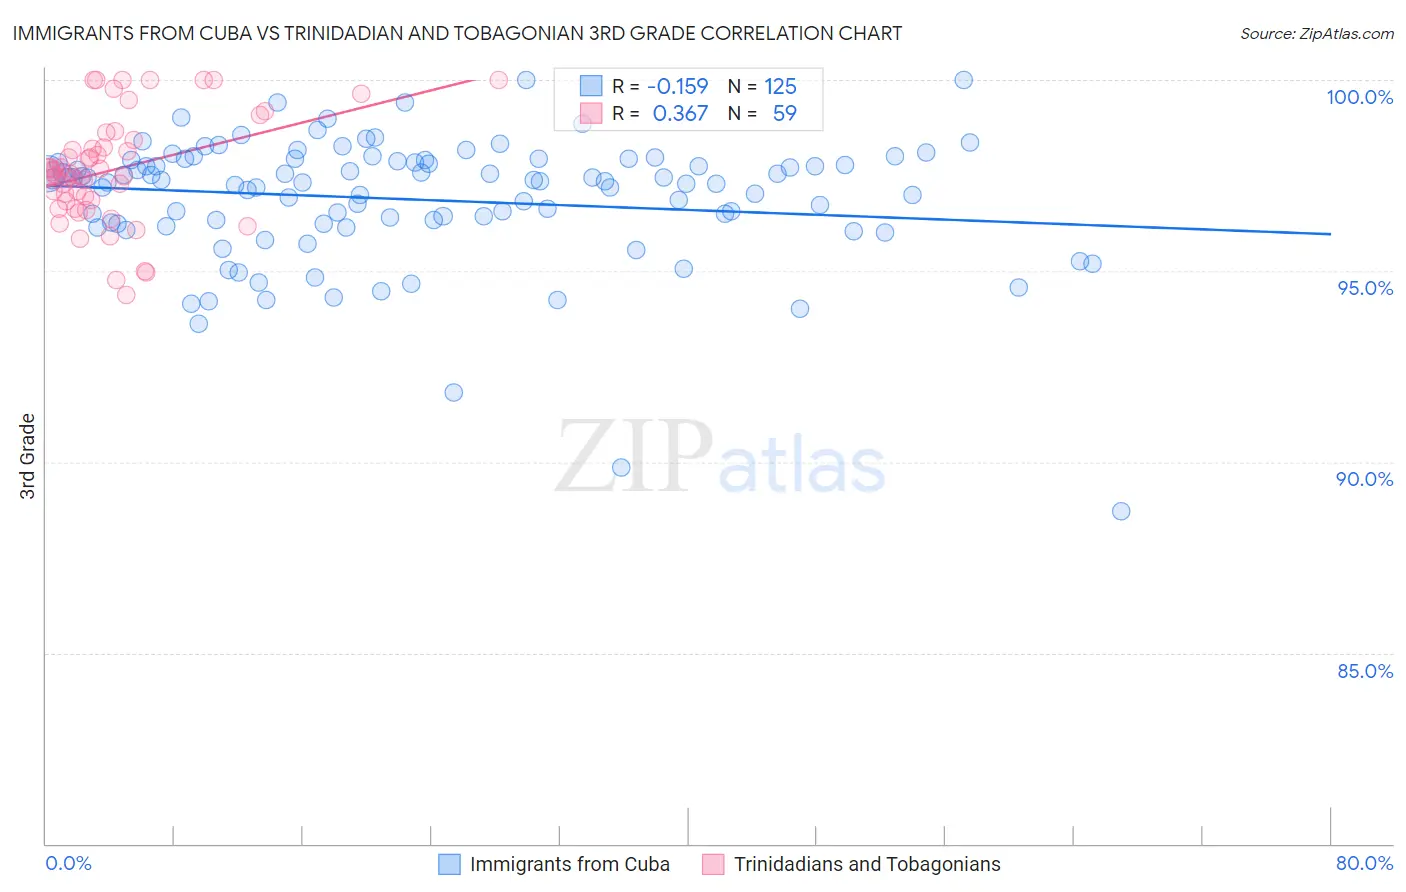
Immigrants from Cuba vs Trinidadian and Tobagonian 3rd Grade Correlation Chart
The statistical analysis conducted on geographies consisting of 326,028,159 people shows a poor negative correlation between the proportion of Immigrants from Cuba and percentage of population with at least 3rd grade education in the United States with a correlation coefficient (R) of -0.159 and weighted average of 96.8%. Similarly, the statistical analysis conducted on geographies consisting of 219,882,819 people shows a mild positive correlation between the proportion of Trinidadians and Tobagonians and percentage of population with at least 3rd grade education in the United States with a correlation coefficient (R) of 0.367 and weighted average of 97.2%, a difference of 0.36%.
3rd Grade Correlation Summary
| Measurement | Immigrants from Cuba | Trinidadian and Tobagonian |
| Minimum | 88.7% | 94.4% |
| Maximum | 100.0% | 100.0% |
| Range | 11.3% | 5.6% |
| Mean | 96.9% | 97.7% |
| Median | 97.3% | 97.6% |
| Interquartile 25% (IQ1) | 96.2% | 96.8% |
| Interquartile 75% (IQ3) | 97.9% | 98.4% |
| Interquartile Range (IQR) | 1.6% | 1.6% |
| Standard Deviation (Sample) | 1.7% | 1.4% |
| Standard Deviation (Population) | 1.7% | 1.4% |
Similar Demographics by 3rd Grade
Demographics Similar to Immigrants from Cuba by 3rd Grade
In terms of 3rd grade, the demographic groups most similar to Immigrants from Cuba are Immigrants from South Eastern Asia (96.8%, a difference of 0.010%), Somali (96.8%, a difference of 0.020%), Haitian (96.9%, a difference of 0.030%), Immigrants from Dominica (96.9%, a difference of 0.030%), and Immigrants (96.9%, a difference of 0.050%).
| Demographics | Rating | Rank | 3rd Grade |
| Malaysians | 0.0 /100 | #294 | Tragic 97.0% |
| Immigrants | Eritrea | 0.0 /100 | #295 | Tragic 97.0% |
| Immigrants | Immigrants | 0.0 /100 | #296 | Tragic 96.9% |
| Haitians | 0.0 /100 | #297 | Tragic 96.9% |
| Immigrants | Dominica | 0.0 /100 | #298 | Tragic 96.9% |
| Somalis | 0.0 /100 | #299 | Tragic 96.8% |
| Immigrants | South Eastern Asia | 0.0 /100 | #300 | Tragic 96.8% |
| Immigrants | Cuba | 0.0 /100 | #301 | Tragic 96.8% |
| Immigrants | Somalia | 0.0 /100 | #302 | Tragic 96.8% |
| Ecuadorians | 0.0 /100 | #303 | Tragic 96.7% |
| Immigrants | Caribbean | 0.0 /100 | #304 | Tragic 96.7% |
| Central American Indians | 0.0 /100 | #305 | Tragic 96.7% |
| Guyanese | 0.0 /100 | #306 | Tragic 96.7% |
| Nicaraguans | 0.0 /100 | #307 | Tragic 96.7% |
| Immigrants | Haiti | 0.0 /100 | #308 | Tragic 96.7% |
Demographics Similar to Trinidadians and Tobagonians by 3rd Grade
In terms of 3rd grade, the demographic groups most similar to Trinidadians and Tobagonians are Immigrants from Bolivia (97.2%, a difference of 0.0%), Immigrants from Western Africa (97.2%, a difference of 0.0%), Immigrants from Philippines (97.2%, a difference of 0.010%), Immigrants from Ghana (97.2%, a difference of 0.010%), and Immigrants from Uzbekistan (97.2%, a difference of 0.020%).
| Demographics | Rating | Rank | 3rd Grade |
| Immigrants | China | 0.2 /100 | #270 | Tragic 97.2% |
| Puerto Ricans | 0.2 /100 | #271 | Tragic 97.2% |
| Ghanaians | 0.1 /100 | #272 | Tragic 97.2% |
| Immigrants | Peru | 0.1 /100 | #273 | Tragic 97.2% |
| Immigrants | Cameroon | 0.1 /100 | #274 | Tragic 97.2% |
| Immigrants | Uzbekistan | 0.1 /100 | #275 | Tragic 97.2% |
| Immigrants | Bolivia | 0.1 /100 | #276 | Tragic 97.2% |
| Trinidadians and Tobagonians | 0.1 /100 | #277 | Tragic 97.2% |
| Immigrants | Western Africa | 0.1 /100 | #278 | Tragic 97.2% |
| Immigrants | Philippines | 0.1 /100 | #279 | Tragic 97.2% |
| Immigrants | Ghana | 0.1 /100 | #280 | Tragic 97.2% |
| Barbadians | 0.1 /100 | #281 | Tragic 97.2% |
| Afghans | 0.1 /100 | #282 | Tragic 97.1% |
| Houma | 0.1 /100 | #283 | Tragic 97.1% |
| Immigrants | Trinidad and Tobago | 0.0 /100 | #284 | Tragic 97.1% |