Bolivian vs Lithuanian 3rd Grade
COMPARE
Bolivian
Lithuanian
3rd Grade
3rd Grade Comparison
Bolivians
Lithuanians
97.3%
3RD GRADE
0.6/ 100
METRIC RATING
255th/ 347
METRIC RANK
98.5%
3RD GRADE
100.0/ 100
METRIC RATING
21st/ 347
METRIC RANK
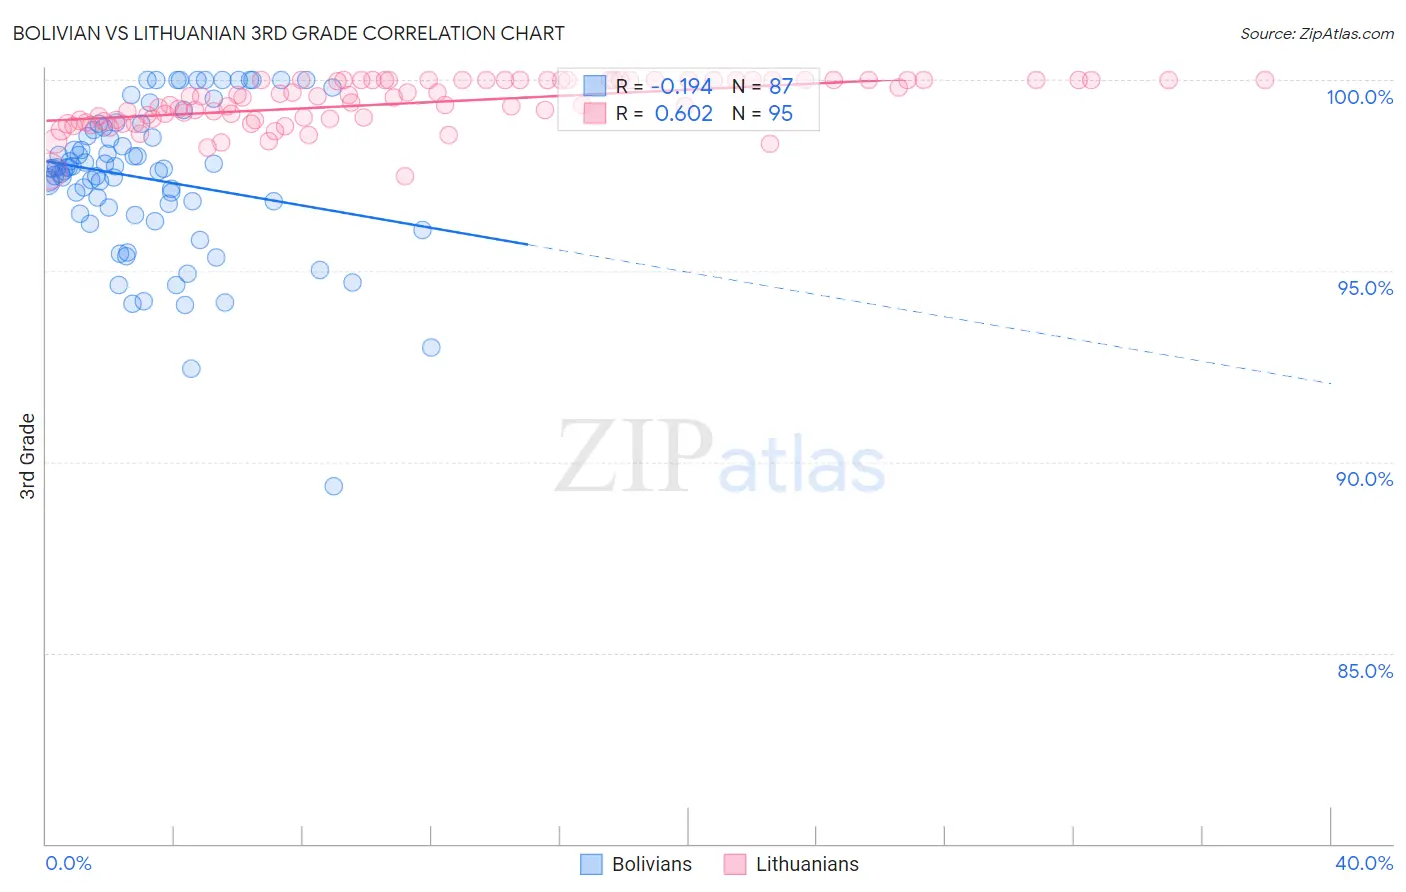
Bolivian vs Lithuanian 3rd Grade Correlation Chart
The statistical analysis conducted on geographies consisting of 184,667,361 people shows a poor negative correlation between the proportion of Bolivians and percentage of population with at least 3rd grade education in the United States with a correlation coefficient (R) of -0.194 and weighted average of 97.3%. Similarly, the statistical analysis conducted on geographies consisting of 421,946,231 people shows a significant positive correlation between the proportion of Lithuanians and percentage of population with at least 3rd grade education in the United States with a correlation coefficient (R) of 0.602 and weighted average of 98.5%, a difference of 1.2%.
3rd Grade Correlation Summary
| Measurement | Bolivian | Lithuanian |
| Minimum | 89.3% | 97.5% |
| Maximum | 100.0% | 100.0% |
| Range | 10.7% | 2.5% |
| Mean | 97.4% | 99.4% |
| Median | 97.7% | 99.5% |
| Interquartile 25% (IQ1) | 96.5% | 99.0% |
| Interquartile 75% (IQ3) | 98.7% | 100.0% |
| Interquartile Range (IQR) | 2.2% | 1.0% |
| Standard Deviation (Sample) | 2.0% | 0.60% |
| Standard Deviation (Population) | 2.0% | 0.60% |
Similar Demographics by 3rd Grade
Demographics Similar to Bolivians by 3rd Grade
In terms of 3rd grade, the demographic groups most similar to Bolivians are Immigrants from Congo (97.3%, a difference of 0.0%), Immigrants from Colombia (97.3%, a difference of 0.010%), Jamaican (97.4%, a difference of 0.020%), Immigrants from Liberia (97.3%, a difference of 0.020%), and Immigrants from Middle Africa (97.4%, a difference of 0.030%).
| Demographics | Rating | Rank | 3rd Grade |
| Immigrants | Eastern Africa | 0.9 /100 | #248 | Tragic 97.4% |
| South Americans | 0.9 /100 | #249 | Tragic 97.4% |
| Immigrants | Middle Africa | 0.9 /100 | #250 | Tragic 97.4% |
| Immigrants | Asia | 0.8 /100 | #251 | Tragic 97.4% |
| Peruvians | 0.8 /100 | #252 | Tragic 97.4% |
| Immigrants | Africa | 0.8 /100 | #253 | Tragic 97.4% |
| Jamaicans | 0.7 /100 | #254 | Tragic 97.4% |
| Bolivians | 0.6 /100 | #255 | Tragic 97.3% |
| Immigrants | Congo | 0.6 /100 | #256 | Tragic 97.3% |
| Immigrants | Colombia | 0.5 /100 | #257 | Tragic 97.3% |
| Immigrants | Liberia | 0.5 /100 | #258 | Tragic 97.3% |
| Armenians | 0.4 /100 | #259 | Tragic 97.3% |
| Immigrants | Ethiopia | 0.4 /100 | #260 | Tragic 97.3% |
| Immigrants | South America | 0.4 /100 | #261 | Tragic 97.3% |
| Immigrants | Sierra Leone | 0.4 /100 | #262 | Tragic 97.3% |
Demographics Similar to Lithuanians by 3rd Grade
In terms of 3rd grade, the demographic groups most similar to Lithuanians are Pennsylvania German (98.5%, a difference of 0.0%), Finnish (98.5%, a difference of 0.0%), Sioux (98.5%, a difference of 0.0%), Irish (98.5%, a difference of 0.010%), and Polish (98.5%, a difference of 0.010%).
| Demographics | Rating | Rank | 3rd Grade |
| Carpatho Rusyns | 100.0 /100 | #14 | Exceptional 98.5% |
| Swedes | 100.0 /100 | #15 | Exceptional 98.5% |
| Scottish | 100.0 /100 | #16 | Exceptional 98.5% |
| Dutch | 100.0 /100 | #17 | Exceptional 98.5% |
| Irish | 100.0 /100 | #18 | Exceptional 98.5% |
| Poles | 100.0 /100 | #19 | Exceptional 98.5% |
| Pennsylvania Germans | 100.0 /100 | #20 | Exceptional 98.5% |
| Lithuanians | 100.0 /100 | #21 | Exceptional 98.5% |
| Finns | 100.0 /100 | #22 | Exceptional 98.5% |
| Sioux | 100.0 /100 | #23 | Exceptional 98.5% |
| Danes | 100.0 /100 | #24 | Exceptional 98.5% |
| Scotch-Irish | 100.0 /100 | #25 | Exceptional 98.5% |
| Aleuts | 100.0 /100 | #26 | Exceptional 98.5% |
| Croatians | 100.0 /100 | #27 | Exceptional 98.5% |
| French | 100.0 /100 | #28 | Exceptional 98.4% |