Immigrants from Bahamas vs Lithuanian 3rd Grade
COMPARE
Immigrants from Bahamas
Lithuanian
3rd Grade
3rd Grade Comparison
Immigrants from Bahamas
Lithuanians
97.6%
3RD GRADE
8.5/ 100
METRIC RATING
212th/ 347
METRIC RANK
98.5%
3RD GRADE
100.0/ 100
METRIC RATING
21st/ 347
METRIC RANK
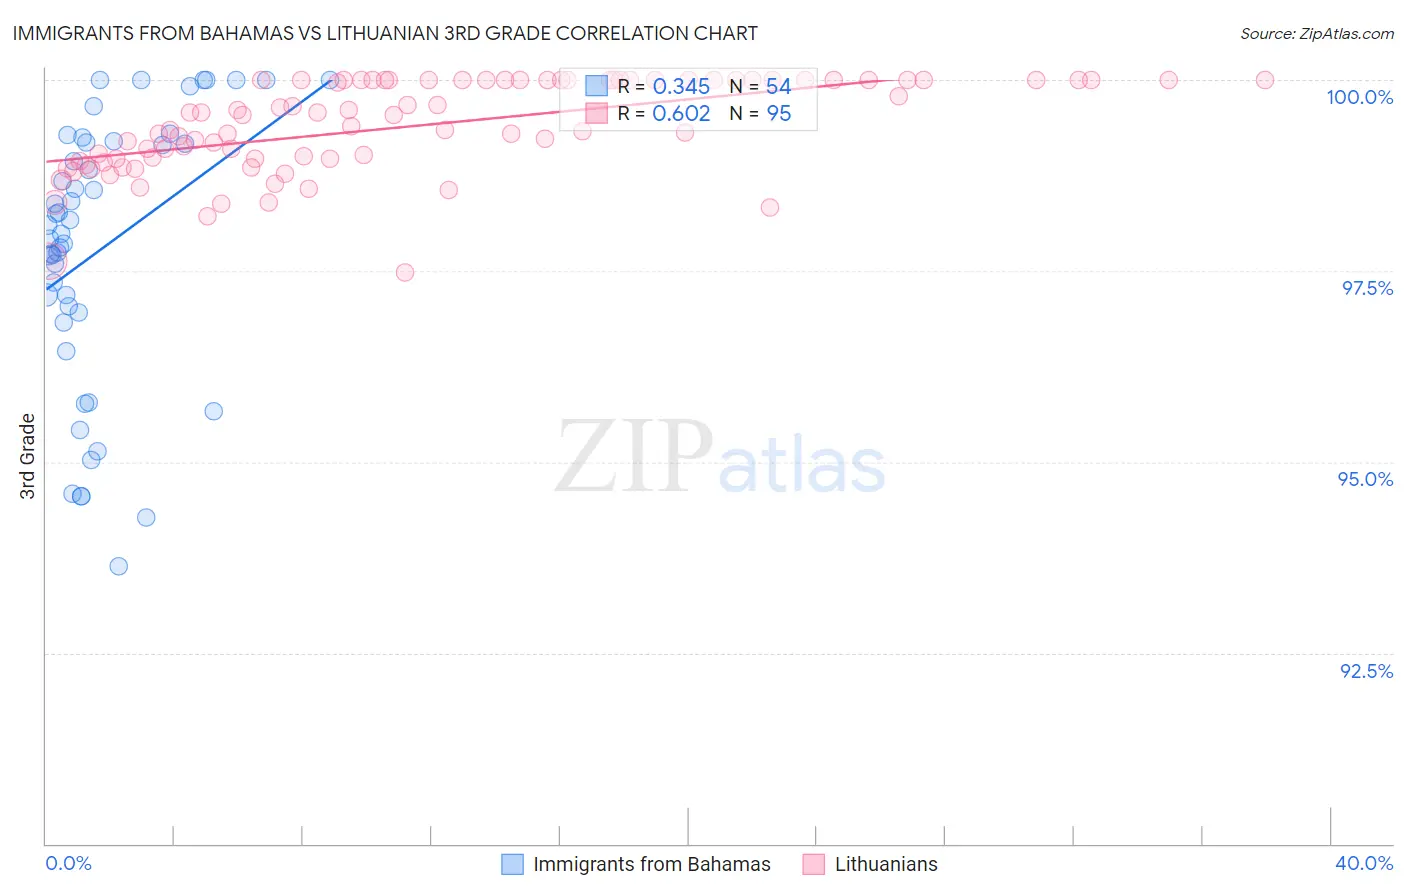
Immigrants from Bahamas vs Lithuanian 3rd Grade Correlation Chart
The statistical analysis conducted on geographies consisting of 104,666,627 people shows a mild positive correlation between the proportion of Immigrants from Bahamas and percentage of population with at least 3rd grade education in the United States with a correlation coefficient (R) of 0.345 and weighted average of 97.6%. Similarly, the statistical analysis conducted on geographies consisting of 421,946,231 people shows a significant positive correlation between the proportion of Lithuanians and percentage of population with at least 3rd grade education in the United States with a correlation coefficient (R) of 0.602 and weighted average of 98.5%, a difference of 0.94%.
3rd Grade Correlation Summary
| Measurement | Immigrants from Bahamas | Lithuanian |
| Minimum | 93.6% | 97.5% |
| Maximum | 100.0% | 100.0% |
| Range | 6.4% | 2.5% |
| Mean | 97.8% | 99.4% |
| Median | 98.0% | 99.5% |
| Interquartile 25% (IQ1) | 97.0% | 99.0% |
| Interquartile 75% (IQ3) | 99.2% | 100.0% |
| Interquartile Range (IQR) | 2.2% | 1.0% |
| Standard Deviation (Sample) | 1.7% | 0.60% |
| Standard Deviation (Population) | 1.7% | 0.60% |
Similar Demographics by 3rd Grade
Demographics Similar to Immigrants from Bahamas by 3rd Grade
In terms of 3rd grade, the demographic groups most similar to Immigrants from Bahamas are Moroccan (97.6%, a difference of 0.0%), Yuman (97.6%, a difference of 0.0%), Costa Rican (97.6%, a difference of 0.010%), Immigrants from Oceania (97.6%, a difference of 0.010%), and Laotian (97.6%, a difference of 0.010%).
| Demographics | Rating | Rank | 3rd Grade |
| Africans | 14.5 /100 | #205 | Poor 97.6% |
| Immigrants | Northern Africa | 13.0 /100 | #206 | Poor 97.6% |
| Tohono O'odham | 12.5 /100 | #207 | Poor 97.6% |
| Immigrants | Zaire | 11.9 /100 | #208 | Poor 97.6% |
| Costa Ricans | 9.6 /100 | #209 | Tragic 97.6% |
| Immigrants | Oceania | 9.5 /100 | #210 | Tragic 97.6% |
| Laotians | 9.4 /100 | #211 | Tragic 97.6% |
| Immigrants | Bahamas | 8.5 /100 | #212 | Tragic 97.6% |
| Moroccans | 8.5 /100 | #213 | Tragic 97.6% |
| Yuman | 8.4 /100 | #214 | Tragic 97.6% |
| Iraqis | 6.9 /100 | #215 | Tragic 97.5% |
| Samoans | 6.9 /100 | #216 | Tragic 97.5% |
| South American Indians | 5.7 /100 | #217 | Tragic 97.5% |
| Immigrants | Nepal | 5.3 /100 | #218 | Tragic 97.5% |
| Immigrants | Panama | 5.2 /100 | #219 | Tragic 97.5% |
Demographics Similar to Lithuanians by 3rd Grade
In terms of 3rd grade, the demographic groups most similar to Lithuanians are Pennsylvania German (98.5%, a difference of 0.0%), Finnish (98.5%, a difference of 0.0%), Sioux (98.5%, a difference of 0.0%), Irish (98.5%, a difference of 0.010%), and Polish (98.5%, a difference of 0.010%).
| Demographics | Rating | Rank | 3rd Grade |
| Carpatho Rusyns | 100.0 /100 | #14 | Exceptional 98.5% |
| Swedes | 100.0 /100 | #15 | Exceptional 98.5% |
| Scottish | 100.0 /100 | #16 | Exceptional 98.5% |
| Dutch | 100.0 /100 | #17 | Exceptional 98.5% |
| Irish | 100.0 /100 | #18 | Exceptional 98.5% |
| Poles | 100.0 /100 | #19 | Exceptional 98.5% |
| Pennsylvania Germans | 100.0 /100 | #20 | Exceptional 98.5% |
| Lithuanians | 100.0 /100 | #21 | Exceptional 98.5% |
| Finns | 100.0 /100 | #22 | Exceptional 98.5% |
| Sioux | 100.0 /100 | #23 | Exceptional 98.5% |
| Danes | 100.0 /100 | #24 | Exceptional 98.5% |
| Scotch-Irish | 100.0 /100 | #25 | Exceptional 98.5% |
| Aleuts | 100.0 /100 | #26 | Exceptional 98.5% |
| Croatians | 100.0 /100 | #27 | Exceptional 98.5% |
| French | 100.0 /100 | #28 | Exceptional 98.4% |