Immigrants from Croatia vs Hopi 8th Grade
COMPARE
Immigrants from Croatia
Hopi
8th Grade
8th Grade Comparison
Immigrants from Croatia
Hopi
96.2%
8TH GRADE
96.0/ 100
METRIC RATING
117th/ 347
METRIC RANK
95.9%
8TH GRADE
79.4/ 100
METRIC RATING
154th/ 347
METRIC RANK
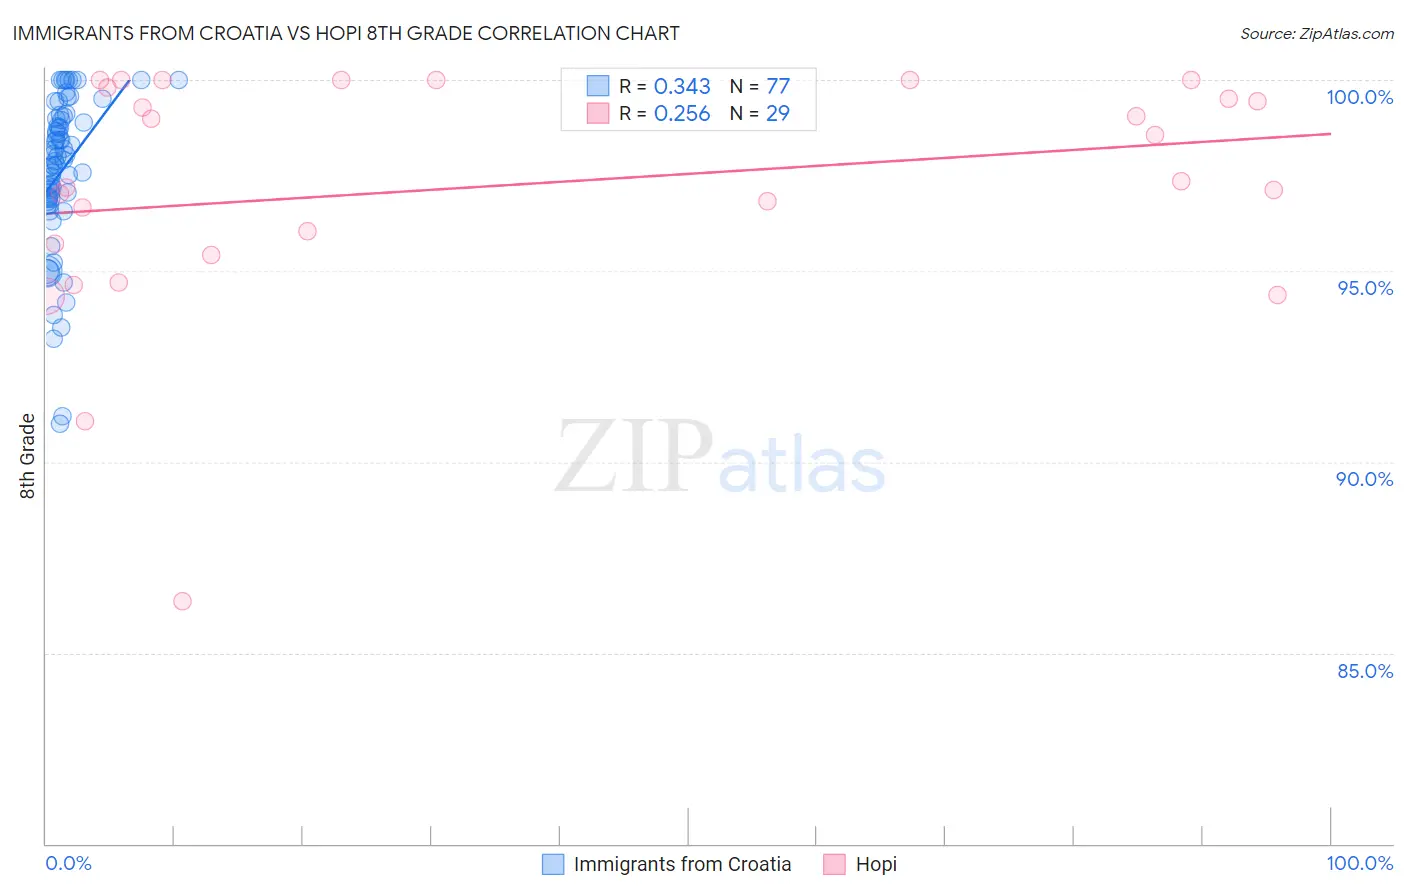
Immigrants from Croatia vs Hopi 8th Grade Correlation Chart
The statistical analysis conducted on geographies consisting of 132,548,291 people shows a mild positive correlation between the proportion of Immigrants from Croatia and percentage of population with at least 8th grade education in the United States with a correlation coefficient (R) of 0.343 and weighted average of 96.2%. Similarly, the statistical analysis conducted on geographies consisting of 74,739,957 people shows a weak positive correlation between the proportion of Hopi and percentage of population with at least 8th grade education in the United States with a correlation coefficient (R) of 0.256 and weighted average of 95.9%, a difference of 0.30%.
8th Grade Correlation Summary
| Measurement | Immigrants from Croatia | Hopi |
| Minimum | 91.0% | 86.4% |
| Maximum | 100.0% | 100.0% |
| Range | 9.0% | 13.6% |
| Mean | 97.6% | 97.2% |
| Median | 97.9% | 97.4% |
| Interquartile 25% (IQ1) | 96.9% | 95.6% |
| Interquartile 75% (IQ3) | 99.0% | 99.9% |
| Interquartile Range (IQR) | 2.1% | 4.3% |
| Standard Deviation (Sample) | 2.0% | 3.1% |
| Standard Deviation (Population) | 1.9% | 3.1% |
Similar Demographics by 8th Grade
Demographics Similar to Immigrants from Croatia by 8th Grade
In terms of 8th grade, the demographic groups most similar to Immigrants from Croatia are Nonimmigrants (96.2%, a difference of 0.0%), Immigrants from Norway (96.2%, a difference of 0.010%), Immigrants from Japan (96.2%, a difference of 0.020%), Immigrants from Moldova (96.2%, a difference of 0.020%), and Syrian (96.3%, a difference of 0.030%).
| Demographics | Rating | Rank | 8th Grade |
| Cajuns | 97.1 /100 | #110 | Exceptional 96.3% |
| Shoshone | 96.8 /100 | #111 | Exceptional 96.3% |
| Syrians | 96.7 /100 | #112 | Exceptional 96.3% |
| Immigrants | Zimbabwe | 96.7 /100 | #113 | Exceptional 96.3% |
| Immigrants | Japan | 96.5 /100 | #114 | Exceptional 96.2% |
| Immigrants | Moldova | 96.5 /100 | #115 | Exceptional 96.2% |
| Immigrants | Nonimmigrants | 96.0 /100 | #116 | Exceptional 96.2% |
| Immigrants | Croatia | 96.0 /100 | #117 | Exceptional 96.2% |
| Immigrants | Norway | 95.7 /100 | #118 | Exceptional 96.2% |
| Immigrants | Switzerland | 95.3 /100 | #119 | Exceptional 96.2% |
| Immigrants | France | 95.3 /100 | #120 | Exceptional 96.2% |
| Immigrants | Bulgaria | 95.3 /100 | #121 | Exceptional 96.2% |
| Immigrants | Europe | 95.3 /100 | #122 | Exceptional 96.2% |
| Filipinos | 94.6 /100 | #123 | Exceptional 96.2% |
| Palestinians | 94.6 /100 | #124 | Exceptional 96.2% |
Demographics Similar to Hopi by 8th Grade
In terms of 8th grade, the demographic groups most similar to Hopi are Immigrants from Jordan (95.9%, a difference of 0.0%), Blackfeet (96.0%, a difference of 0.010%), French American Indian (96.0%, a difference of 0.010%), Immigrants from Israel (96.0%, a difference of 0.020%), and Immigrants from Russia (96.0%, a difference of 0.020%).
| Demographics | Rating | Rank | 8th Grade |
| Colville | 84.0 /100 | #147 | Excellent 96.0% |
| Albanians | 83.1 /100 | #148 | Excellent 96.0% |
| Immigrants | Israel | 81.3 /100 | #149 | Excellent 96.0% |
| Immigrants | Russia | 80.9 /100 | #150 | Excellent 96.0% |
| Blackfeet | 80.8 /100 | #151 | Excellent 96.0% |
| French American Indians | 80.6 /100 | #152 | Excellent 96.0% |
| Immigrants | Jordan | 79.5 /100 | #153 | Good 95.9% |
| Hopi | 79.4 /100 | #154 | Good 95.9% |
| Kenyans | 74.5 /100 | #155 | Good 95.9% |
| Ugandans | 74.1 /100 | #156 | Good 95.9% |
| Immigrants | Taiwan | 70.5 /100 | #157 | Good 95.9% |
| Arabs | 69.4 /100 | #158 | Good 95.9% |
| Immigrants | Kazakhstan | 68.4 /100 | #159 | Good 95.9% |
| Seminole | 67.7 /100 | #160 | Good 95.8% |
| Bermudans | 67.5 /100 | #161 | Good 95.8% |