Central American Indian vs Irish Associate's Degree
COMPARE
Central American Indian
Irish
Associate's Degree
Associate's Degree Comparison
Central American Indians
Irish
40.8%
ASSOCIATE'S DEGREE
0.2/ 100
METRIC RATING
268th/ 347
METRIC RANK
46.5%
ASSOCIATE'S DEGREE
53.6/ 100
METRIC RATING
170th/ 347
METRIC RANK
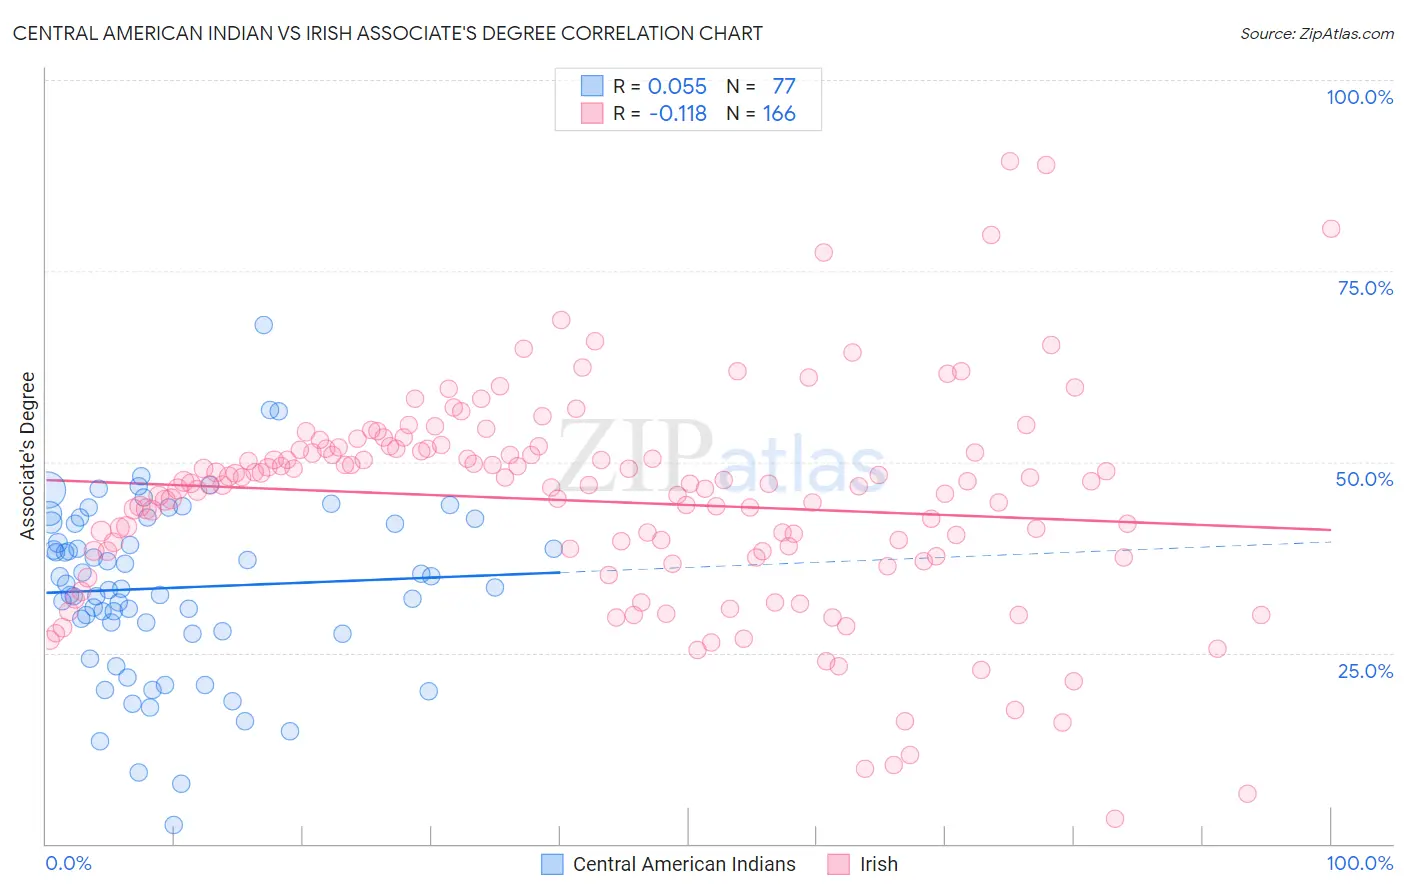
Central American Indian vs Irish Associate's Degree Correlation Chart
The statistical analysis conducted on geographies consisting of 326,135,740 people shows a slight positive correlation between the proportion of Central American Indians and percentage of population with at least associate's degree education in the United States with a correlation coefficient (R) of 0.055 and weighted average of 40.8%. Similarly, the statistical analysis conducted on geographies consisting of 580,555,022 people shows a poor negative correlation between the proportion of Irish and percentage of population with at least associate's degree education in the United States with a correlation coefficient (R) of -0.118 and weighted average of 46.5%, a difference of 13.8%.
Associate's Degree Correlation Summary
| Measurement | Central American Indian | Irish |
| Minimum | 2.5% | 3.2% |
| Maximum | 67.9% | 89.4% |
| Range | 65.4% | 86.2% |
| Mean | 33.5% | 44.9% |
| Median | 33.6% | 47.1% |
| Interquartile 25% (IQ1) | 27.7% | 38.3% |
| Interquartile 75% (IQ3) | 42.0% | 51.7% |
| Interquartile Range (IQR) | 14.3% | 13.4% |
| Standard Deviation (Sample) | 11.5% | 13.9% |
| Standard Deviation (Population) | 11.4% | 13.9% |
Similar Demographics by Associate's Degree
Demographics Similar to Central American Indians by Associate's Degree
In terms of associate's degree, the demographic groups most similar to Central American Indians are American (40.8%, a difference of 0.18%), Hawaiian (40.9%, a difference of 0.20%), Chippewa (40.7%, a difference of 0.23%), Immigrants from Laos (40.7%, a difference of 0.41%), and Belizean (40.6%, a difference of 0.48%).
| Demographics | Rating | Rank | Associate's Degree |
| Nicaraguans | 0.4 /100 | #261 | Tragic 41.5% |
| Bahamians | 0.4 /100 | #262 | Tragic 41.5% |
| Immigrants | Jamaica | 0.3 /100 | #263 | Tragic 41.5% |
| Osage | 0.3 /100 | #264 | Tragic 41.5% |
| Africans | 0.2 /100 | #265 | Tragic 41.1% |
| Samoans | 0.2 /100 | #266 | Tragic 41.1% |
| Hawaiians | 0.2 /100 | #267 | Tragic 40.9% |
| Central American Indians | 0.2 /100 | #268 | Tragic 40.8% |
| Americans | 0.2 /100 | #269 | Tragic 40.8% |
| Chippewa | 0.2 /100 | #270 | Tragic 40.7% |
| Immigrants | Laos | 0.1 /100 | #271 | Tragic 40.7% |
| Belizeans | 0.1 /100 | #272 | Tragic 40.6% |
| Puget Sound Salish | 0.1 /100 | #273 | Tragic 40.5% |
| Immigrants | Dominica | 0.1 /100 | #274 | Tragic 40.5% |
| Potawatomi | 0.1 /100 | #275 | Tragic 40.4% |
Demographics Similar to Irish by Associate's Degree
In terms of associate's degree, the demographic groups most similar to Irish are Basque (46.5%, a difference of 0.060%), Uruguayan (46.5%, a difference of 0.13%), Immigrants from Somalia (46.5%, a difference of 0.14%), Peruvian (46.4%, a difference of 0.24%), and Immigrants from Iraq (46.4%, a difference of 0.25%).
| Demographics | Rating | Rank | Associate's Degree |
| Somalis | 62.5 /100 | #163 | Good 46.8% |
| Colombians | 62.4 /100 | #164 | Good 46.8% |
| Immigrants | South America | 59.9 /100 | #165 | Average 46.7% |
| Hungarians | 59.3 /100 | #166 | Average 46.7% |
| Immigrants | Sierra Leone | 59.2 /100 | #167 | Average 46.7% |
| Immigrants | Somalia | 55.5 /100 | #168 | Average 46.5% |
| Uruguayans | 55.4 /100 | #169 | Average 46.5% |
| Irish | 53.6 /100 | #170 | Average 46.5% |
| Basques | 52.8 /100 | #171 | Average 46.5% |
| Peruvians | 50.5 /100 | #172 | Average 46.4% |
| Immigrants | Iraq | 50.3 /100 | #173 | Average 46.4% |
| English | 50.0 /100 | #174 | Average 46.4% |
| Belgians | 48.9 /100 | #175 | Average 46.3% |
| Finns | 48.5 /100 | #176 | Average 46.3% |
| Slovaks | 48.4 /100 | #177 | Average 46.3% |