Immigrants from Colombia vs Immigrants from Romania 2nd Grade
COMPARE
Immigrants from Colombia
Immigrants from Romania
2nd Grade
2nd Grade Comparison
Immigrants from Colombia
Immigrants from Romania
97.5%
2ND GRADE
0.5/ 100
METRIC RATING
257th/ 347
METRIC RANK
98.0%
2ND GRADE
88.3/ 100
METRIC RATING
137th/ 347
METRIC RANK
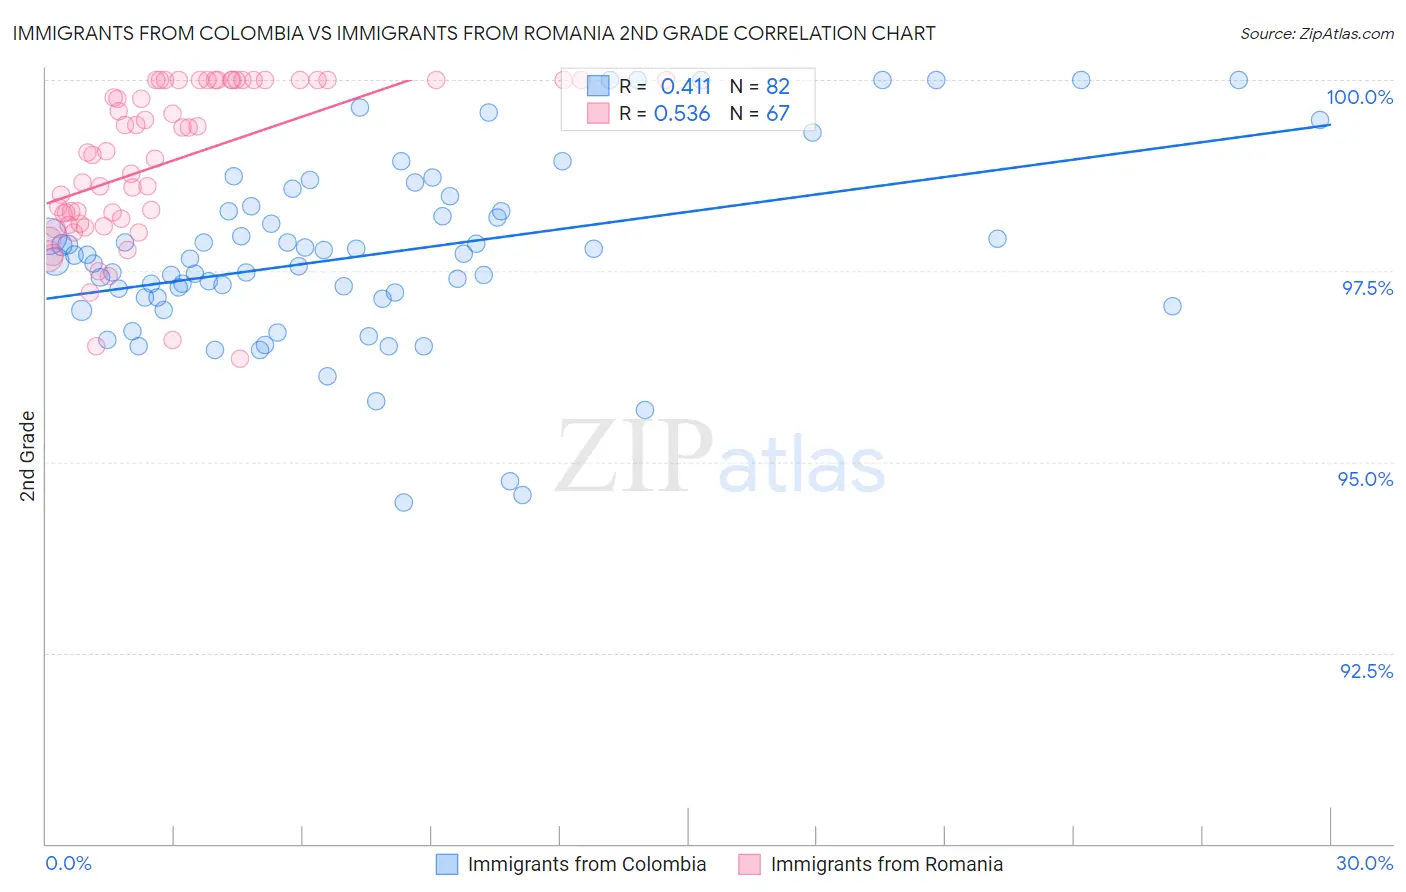
Immigrants from Colombia vs Immigrants from Romania 2nd Grade Correlation Chart
The statistical analysis conducted on geographies consisting of 378,643,693 people shows a moderate positive correlation between the proportion of Immigrants from Colombia and percentage of population with at least 2nd grade education in the United States with a correlation coefficient (R) of 0.411 and weighted average of 97.5%. Similarly, the statistical analysis conducted on geographies consisting of 257,006,599 people shows a substantial positive correlation between the proportion of Immigrants from Romania and percentage of population with at least 2nd grade education in the United States with a correlation coefficient (R) of 0.536 and weighted average of 98.0%, a difference of 0.57%.
2nd Grade Correlation Summary
| Measurement | Immigrants from Colombia | Immigrants from Romania |
| Minimum | 94.5% | 96.4% |
| Maximum | 100.0% | 100.0% |
| Range | 5.5% | 3.6% |
| Mean | 97.7% | 98.9% |
| Median | 97.7% | 99.1% |
| Interquartile 25% (IQ1) | 97.1% | 98.1% |
| Interquartile 75% (IQ3) | 98.3% | 100.0% |
| Interquartile Range (IQR) | 1.1% | 1.9% |
| Standard Deviation (Sample) | 1.2% | 1.0% |
| Standard Deviation (Population) | 1.2% | 1.0% |
Similar Demographics by 2nd Grade
Demographics Similar to Immigrants from Colombia by 2nd Grade
In terms of 2nd grade, the demographic groups most similar to Immigrants from Colombia are Jamaican (97.5%, a difference of 0.0%), Indian (Asian) (97.5%, a difference of 0.010%), Immigrants from Congo (97.5%, a difference of 0.010%), Yaqui (97.5%, a difference of 0.010%), and Fijian (97.5%, a difference of 0.010%).
| Demographics | Rating | Rank | 2nd Grade |
| Peruvians | 0.9 /100 | #250 | Tragic 97.5% |
| Immigrants | Africa | 0.8 /100 | #251 | Tragic 97.5% |
| Immigrants | Asia | 0.7 /100 | #252 | Tragic 97.5% |
| Puerto Ricans | 0.7 /100 | #253 | Tragic 97.5% |
| Indians (Asian) | 0.6 /100 | #254 | Tragic 97.5% |
| Immigrants | Congo | 0.6 /100 | #255 | Tragic 97.5% |
| Jamaicans | 0.6 /100 | #256 | Tragic 97.5% |
| Immigrants | Colombia | 0.5 /100 | #257 | Tragic 97.5% |
| Yaqui | 0.5 /100 | #258 | Tragic 97.5% |
| Fijians | 0.5 /100 | #259 | Tragic 97.5% |
| Assyrians/Chaldeans/Syriacs | 0.5 /100 | #260 | Tragic 97.5% |
| Armenians | 0.5 /100 | #261 | Tragic 97.5% |
| Taiwanese | 0.4 /100 | #262 | Tragic 97.4% |
| Immigrants | Ethiopia | 0.4 /100 | #263 | Tragic 97.4% |
| Immigrants | Liberia | 0.4 /100 | #264 | Tragic 97.4% |
Demographics Similar to Immigrants from Romania by 2nd Grade
In terms of 2nd grade, the demographic groups most similar to Immigrants from Romania are Israeli (98.0%, a difference of 0.0%), Immigrants from Hungary (98.0%, a difference of 0.010%), Immigrants from Bulgaria (98.0%, a difference of 0.010%), Immigrants from Kuwait (98.0%, a difference of 0.010%), and Blackfeet (98.0%, a difference of 0.010%).
| Demographics | Rating | Rank | 2nd Grade |
| Seminole | 91.1 /100 | #130 | Exceptional 98.0% |
| Immigrants | Europe | 91.1 /100 | #131 | Exceptional 98.0% |
| Spaniards | 90.7 /100 | #132 | Exceptional 98.0% |
| Cambodians | 90.7 /100 | #133 | Exceptional 98.0% |
| Immigrants | Hungary | 89.7 /100 | #134 | Excellent 98.0% |
| Immigrants | Bulgaria | 89.7 /100 | #135 | Excellent 98.0% |
| Immigrants | Kuwait | 89.2 /100 | #136 | Excellent 98.0% |
| Immigrants | Romania | 88.3 /100 | #137 | Excellent 98.0% |
| Israelis | 87.9 /100 | #138 | Excellent 98.0% |
| Blackfeet | 87.5 /100 | #139 | Excellent 98.0% |
| Palestinians | 83.9 /100 | #140 | Excellent 98.0% |
| Immigrants | Turkey | 83.0 /100 | #141 | Excellent 98.0% |
| Burmese | 81.0 /100 | #142 | Excellent 98.0% |
| Alsatians | 80.5 /100 | #143 | Excellent 98.0% |
| Hmong | 80.0 /100 | #144 | Good 98.0% |