Immigrants from Hungary vs Haitian Master's Degree
COMPARE
Immigrants from Hungary
Haitian
Master's Degree
Master's Degree Comparison
Immigrants from Hungary
Haitians
17.5%
MASTER'S DEGREE
99.6/ 100
METRIC RATING
78th/ 347
METRIC RANK
12.1%
MASTER'S DEGREE
0.3/ 100
METRIC RATING
271st/ 347
METRIC RANK
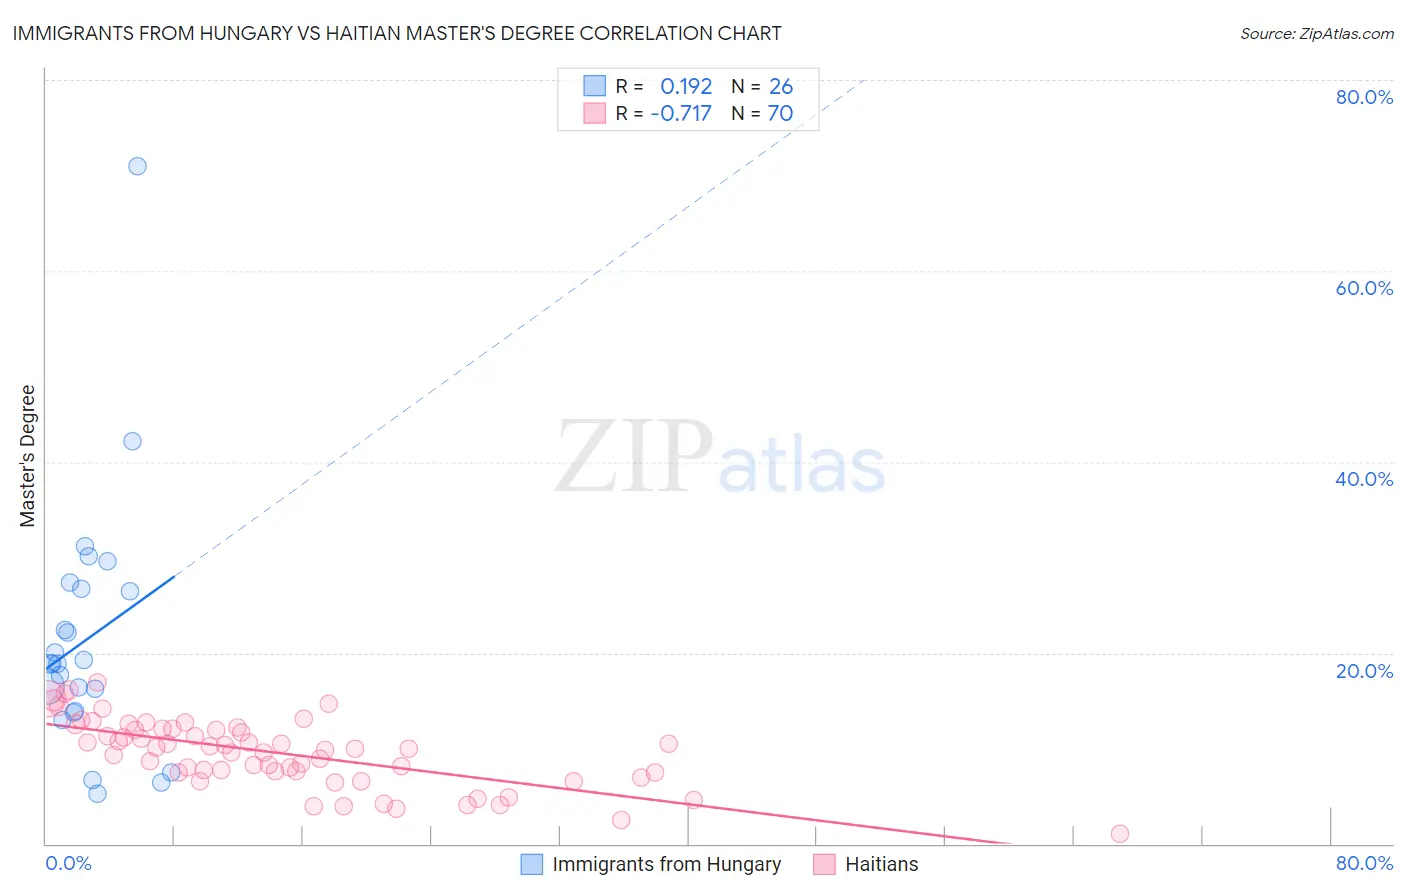
Immigrants from Hungary vs Haitian Master's Degree Correlation Chart
The statistical analysis conducted on geographies consisting of 195,675,976 people shows a poor positive correlation between the proportion of Immigrants from Hungary and percentage of population with at least master's degree education in the United States with a correlation coefficient (R) of 0.192 and weighted average of 17.5%. Similarly, the statistical analysis conducted on geographies consisting of 287,849,817 people shows a strong negative correlation between the proportion of Haitians and percentage of population with at least master's degree education in the United States with a correlation coefficient (R) of -0.717 and weighted average of 12.1%, a difference of 44.9%.
Master's Degree Correlation Summary
| Measurement | Immigrants from Hungary | Haitian |
| Minimum | 5.3% | 1.1% |
| Maximum | 71.0% | 16.9% |
| Range | 65.8% | 15.8% |
| Mean | 21.5% | 9.5% |
| Median | 18.9% | 10.0% |
| Interquartile 25% (IQ1) | 13.9% | 7.5% |
| Interquartile 75% (IQ3) | 26.7% | 12.0% |
| Interquartile Range (IQR) | 12.8% | 4.6% |
| Standard Deviation (Sample) | 13.3% | 3.5% |
| Standard Deviation (Population) | 13.0% | 3.5% |
Similar Demographics by Master's Degree
Demographics Similar to Immigrants from Hungary by Master's Degree
In terms of master's degree, the demographic groups most similar to Immigrants from Hungary are Immigrants from Lebanon (17.5%, a difference of 0.13%), Immigrants from Eastern Europe (17.6%, a difference of 0.19%), Carpatho Rusyn (17.5%, a difference of 0.19%), Immigrants from Indonesia (17.6%, a difference of 0.31%), and Egyptian (17.6%, a difference of 0.34%).
| Demographics | Rating | Rank | Master's Degree |
| Immigrants | Pakistan | 99.7 /100 | #71 | Exceptional 17.8% |
| Lithuanians | 99.7 /100 | #72 | Exceptional 17.7% |
| Zimbabweans | 99.7 /100 | #73 | Exceptional 17.7% |
| Immigrants | Romania | 99.7 /100 | #74 | Exceptional 17.7% |
| Egyptians | 99.6 /100 | #75 | Exceptional 17.6% |
| Immigrants | Indonesia | 99.6 /100 | #76 | Exceptional 17.6% |
| Immigrants | Eastern Europe | 99.6 /100 | #77 | Exceptional 17.6% |
| Immigrants | Hungary | 99.6 /100 | #78 | Exceptional 17.5% |
| Immigrants | Lebanon | 99.6 /100 | #79 | Exceptional 17.5% |
| Carpatho Rusyns | 99.6 /100 | #80 | Exceptional 17.5% |
| Immigrants | Western Asia | 99.5 /100 | #81 | Exceptional 17.5% |
| Greeks | 99.5 /100 | #82 | Exceptional 17.5% |
| Immigrants | Zimbabwe | 99.5 /100 | #83 | Exceptional 17.4% |
| Immigrants | Scotland | 99.4 /100 | #84 | Exceptional 17.4% |
| Immigrants | Brazil | 99.4 /100 | #85 | Exceptional 17.4% |
Demographics Similar to Haitians by Master's Degree
In terms of master's degree, the demographic groups most similar to Haitians are Comanche (12.1%, a difference of 0.060%), Blackfeet (12.1%, a difference of 0.15%), Cape Verdean (12.1%, a difference of 0.24%), Cuban (12.1%, a difference of 0.25%), and Black/African American (12.1%, a difference of 0.31%).
| Demographics | Rating | Rank | Master's Degree |
| Belizeans | 0.5 /100 | #264 | Tragic 12.4% |
| Immigrants | Fiji | 0.5 /100 | #265 | Tragic 12.4% |
| Bahamians | 0.5 /100 | #266 | Tragic 12.4% |
| Americans | 0.4 /100 | #267 | Tragic 12.3% |
| Native Hawaiians | 0.4 /100 | #268 | Tragic 12.3% |
| Central Americans | 0.3 /100 | #269 | Tragic 12.2% |
| Salvadorans | 0.3 /100 | #270 | Tragic 12.2% |
| Haitians | 0.3 /100 | #271 | Tragic 12.1% |
| Comanche | 0.3 /100 | #272 | Tragic 12.1% |
| Blackfeet | 0.3 /100 | #273 | Tragic 12.1% |
| Cape Verdeans | 0.3 /100 | #274 | Tragic 12.1% |
| Cubans | 0.3 /100 | #275 | Tragic 12.1% |
| Blacks/African Americans | 0.3 /100 | #276 | Tragic 12.1% |
| Immigrants | Caribbean | 0.3 /100 | #277 | Tragic 12.1% |
| Potawatomi | 0.3 /100 | #278 | Tragic 12.1% |