Immigrants from Europe vs British 6th Grade
COMPARE
Immigrants from Europe
British
6th Grade
6th Grade Comparison
Immigrants from Europe
British
97.3%
6TH GRADE
91.1/ 100
METRIC RATING
131st/ 347
METRIC RANK
97.9%
6TH GRADE
100.0/ 100
METRIC RATING
37th/ 347
METRIC RANK
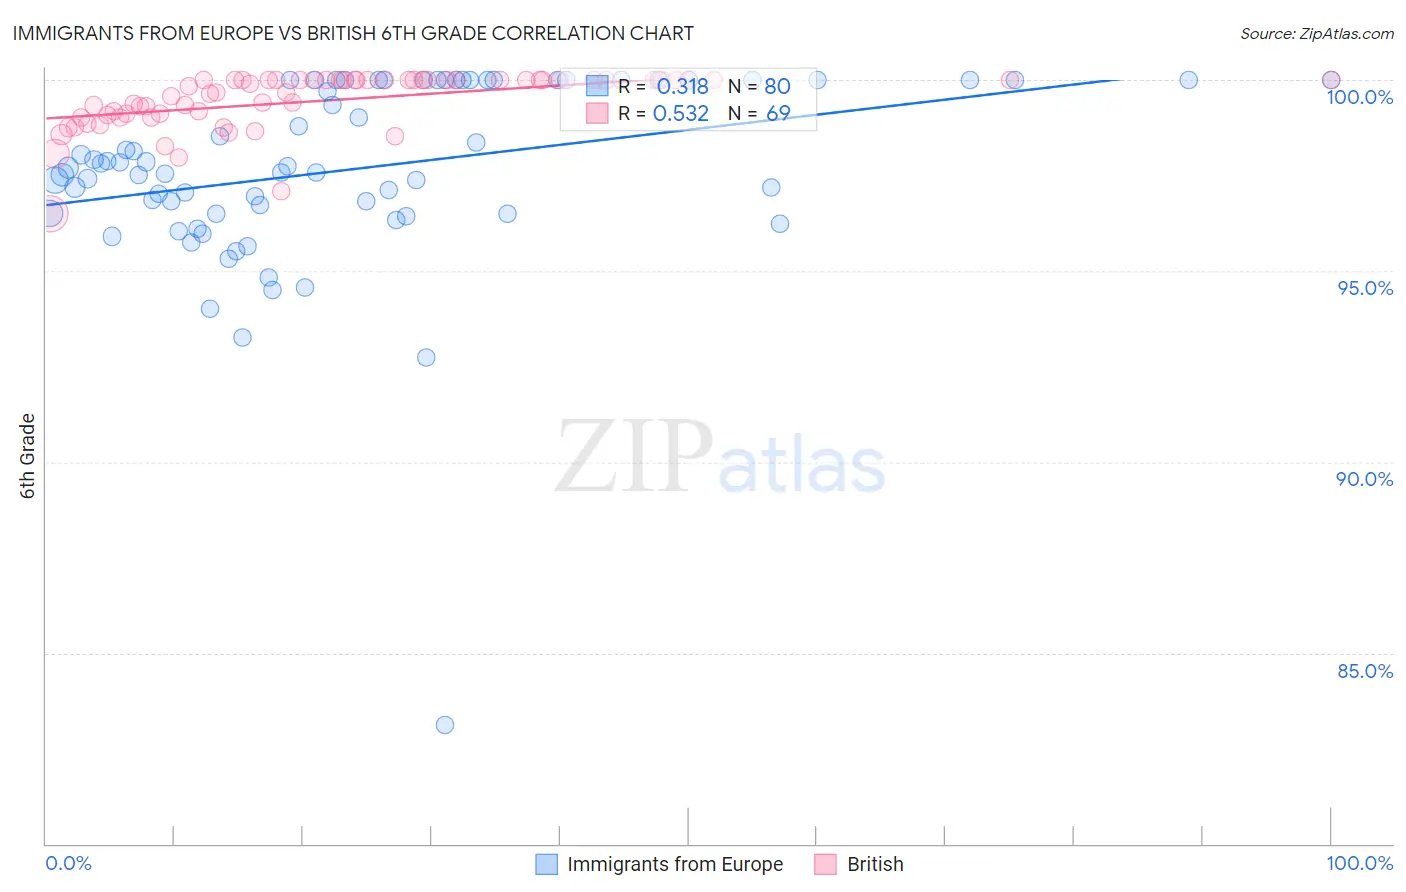
Immigrants from Europe vs British 6th Grade Correlation Chart
The statistical analysis conducted on geographies consisting of 547,425,973 people shows a mild positive correlation between the proportion of Immigrants from Europe and percentage of population with at least 6th grade education in the United States with a correlation coefficient (R) of 0.318 and weighted average of 97.3%. Similarly, the statistical analysis conducted on geographies consisting of 531,462,526 people shows a substantial positive correlation between the proportion of British and percentage of population with at least 6th grade education in the United States with a correlation coefficient (R) of 0.532 and weighted average of 97.9%, a difference of 0.62%.
6th Grade Correlation Summary
| Measurement | Immigrants from Europe | British |
| Minimum | 83.1% | 96.5% |
| Maximum | 100.0% | 100.0% |
| Range | 16.9% | 3.5% |
| Mean | 97.7% | 99.5% |
| Median | 97.7% | 99.9% |
| Interquartile 25% (IQ1) | 96.5% | 99.1% |
| Interquartile 75% (IQ3) | 100.0% | 100.0% |
| Interquartile Range (IQR) | 3.5% | 0.94% |
| Standard Deviation (Sample) | 2.5% | 0.74% |
| Standard Deviation (Population) | 2.5% | 0.73% |
Similar Demographics by 6th Grade
Demographics Similar to Immigrants from Europe by 6th Grade
In terms of 6th grade, the demographic groups most similar to Immigrants from Europe are Palestinian (97.3%, a difference of 0.0%), Immigrants from Romania (97.3%, a difference of 0.010%), Immigrants from Serbia (97.3%, a difference of 0.010%), Cambodian (97.3%, a difference of 0.010%), and Immigrants from Moldova (97.3%, a difference of 0.010%).
| Demographics | Rating | Rank | 6th Grade |
| Okinawans | 94.2 /100 | #124 | Exceptional 97.4% |
| Spanish | 93.7 /100 | #125 | Exceptional 97.3% |
| Immigrants | Bulgaria | 93.6 /100 | #126 | Exceptional 97.3% |
| Immigrants | Croatia | 93.1 /100 | #127 | Exceptional 97.3% |
| Immigrants | Romania | 92.0 /100 | #128 | Exceptional 97.3% |
| Immigrants | Serbia | 91.9 /100 | #129 | Exceptional 97.3% |
| Cambodians | 91.8 /100 | #130 | Exceptional 97.3% |
| Immigrants | Europe | 91.1 /100 | #131 | Exceptional 97.3% |
| Palestinians | 90.9 /100 | #132 | Exceptional 97.3% |
| Immigrants | Moldova | 90.0 /100 | #133 | Excellent 97.3% |
| Immigrants | Kuwait | 89.5 /100 | #134 | Excellent 97.3% |
| Immigrants | Hungary | 89.5 /100 | #135 | Excellent 97.3% |
| Filipinos | 88.9 /100 | #136 | Excellent 97.3% |
| Burmese | 87.8 /100 | #137 | Excellent 97.3% |
| Blackfeet | 87.7 /100 | #138 | Excellent 97.3% |
Demographics Similar to British by 6th Grade
In terms of 6th grade, the demographic groups most similar to British are Chinese (97.9%, a difference of 0.010%), Italian (97.9%, a difference of 0.010%), Belgian (97.9%, a difference of 0.020%), Luxembourger (97.9%, a difference of 0.020%), and Swiss (97.9%, a difference of 0.030%).
| Demographics | Rating | Rank | 6th Grade |
| French Canadians | 100.0 /100 | #30 | Exceptional 98.0% |
| Europeans | 100.0 /100 | #31 | Exceptional 98.0% |
| Alaska Natives | 100.0 /100 | #32 | Exceptional 98.0% |
| Chippewa | 100.0 /100 | #33 | Exceptional 97.9% |
| Swiss | 100.0 /100 | #34 | Exceptional 97.9% |
| Chinese | 100.0 /100 | #35 | Exceptional 97.9% |
| Italians | 100.0 /100 | #36 | Exceptional 97.9% |
| British | 100.0 /100 | #37 | Exceptional 97.9% |
| Belgians | 100.0 /100 | #38 | Exceptional 97.9% |
| Luxembourgers | 99.9 /100 | #39 | Exceptional 97.9% |
| Latvians | 99.9 /100 | #40 | Exceptional 97.9% |
| Eastern Europeans | 99.9 /100 | #41 | Exceptional 97.9% |
| Hungarians | 99.9 /100 | #42 | Exceptional 97.8% |
| Northern Europeans | 99.9 /100 | #43 | Exceptional 97.8% |
| Czechoslovakians | 99.9 /100 | #44 | Exceptional 97.8% |