Immigrants from Cambodia vs Belgian 5th Grade
COMPARE
Immigrants from Cambodia
Belgian
5th Grade
5th Grade Comparison
Immigrants from Cambodia
Belgians
95.5%
5TH GRADE
0.0/ 100
METRIC RATING
326th/ 347
METRIC RANK
98.1%
5TH GRADE
99.9/ 100
METRIC RATING
38th/ 347
METRIC RANK
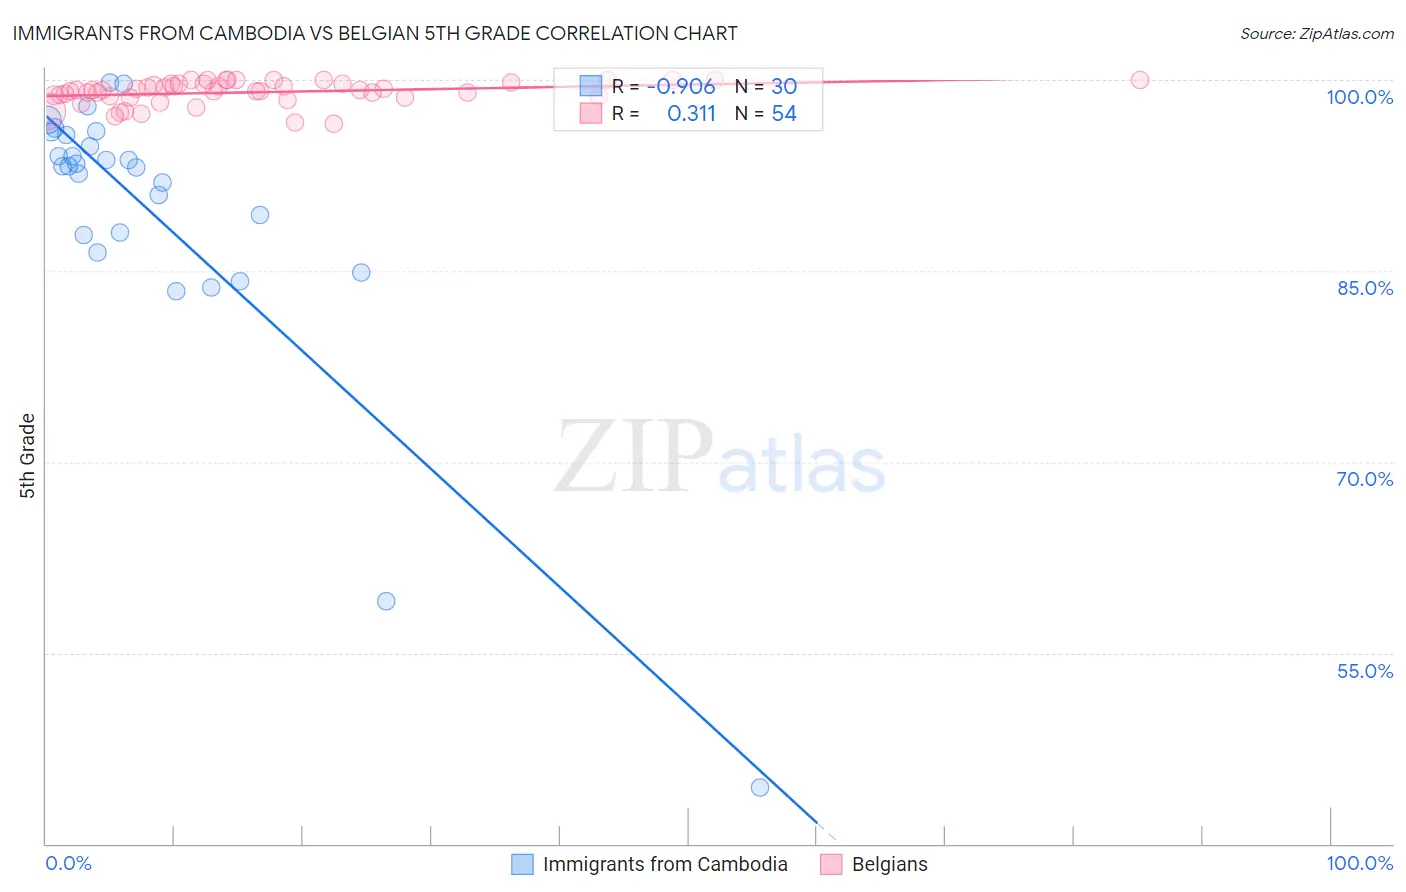
Immigrants from Cambodia vs Belgian 5th Grade Correlation Chart
The statistical analysis conducted on geographies consisting of 205,153,442 people shows a near-perfect negative correlation between the proportion of Immigrants from Cambodia and percentage of population with at least 5th grade education in the United States with a correlation coefficient (R) of -0.906 and weighted average of 95.5%. Similarly, the statistical analysis conducted on geographies consisting of 356,016,627 people shows a mild positive correlation between the proportion of Belgians and percentage of population with at least 5th grade education in the United States with a correlation coefficient (R) of 0.311 and weighted average of 98.1%, a difference of 2.6%.
5th Grade Correlation Summary
| Measurement | Immigrants from Cambodia | Belgian |
| Minimum | 44.4% | 96.6% |
| Maximum | 99.8% | 100.0% |
| Range | 55.4% | 3.4% |
| Mean | 89.6% | 99.0% |
| Median | 93.3% | 99.2% |
| Interquartile 25% (IQ1) | 87.8% | 98.7% |
| Interquartile 75% (IQ3) | 95.7% | 99.7% |
| Interquartile Range (IQR) | 7.9% | 1.0% |
| Standard Deviation (Sample) | 11.4% | 0.90% |
| Standard Deviation (Population) | 11.2% | 0.89% |
Similar Demographics by 5th Grade
Demographics Similar to Immigrants from Cambodia by 5th Grade
In terms of 5th grade, the demographic groups most similar to Immigrants from Cambodia are Dominican (95.5%, a difference of 0.0%), Honduran (95.6%, a difference of 0.030%), Hispanic or Latino (95.6%, a difference of 0.030%), Cape Verdean (95.5%, a difference of 0.030%), and Mexican American Indian (95.5%, a difference of 0.040%).
| Demographics | Rating | Rank | 5th Grade |
| Japanese | 0.0 /100 | #319 | Tragic 95.7% |
| Central American Indians | 0.0 /100 | #320 | Tragic 95.7% |
| Immigrants | Belize | 0.0 /100 | #321 | Tragic 95.7% |
| Immigrants | Nicaragua | 0.0 /100 | #322 | Tragic 95.6% |
| Immigrants | Fiji | 0.0 /100 | #323 | Tragic 95.6% |
| Hondurans | 0.0 /100 | #324 | Tragic 95.6% |
| Hispanics or Latinos | 0.0 /100 | #325 | Tragic 95.6% |
| Immigrants | Cambodia | 0.0 /100 | #326 | Tragic 95.5% |
| Dominicans | 0.0 /100 | #327 | Tragic 95.5% |
| Cape Verdeans | 0.0 /100 | #328 | Tragic 95.5% |
| Mexican American Indians | 0.0 /100 | #329 | Tragic 95.5% |
| Immigrants | Armenia | 0.0 /100 | #330 | Tragic 95.4% |
| Immigrants | Honduras | 0.0 /100 | #331 | Tragic 95.4% |
| Immigrants | Dominican Republic | 0.0 /100 | #332 | Tragic 95.3% |
| Immigrants | Latin America | 0.0 /100 | #333 | Tragic 95.3% |
Demographics Similar to Belgians by 5th Grade
In terms of 5th grade, the demographic groups most similar to Belgians are Latvian (98.1%, a difference of 0.010%), Luxembourger (98.1%, a difference of 0.010%), Eastern European (98.1%, a difference of 0.010%), British (98.1%, a difference of 0.030%), and Italian (98.1%, a difference of 0.040%).
| Demographics | Rating | Rank | 5th Grade |
| Europeans | 100.0 /100 | #31 | Exceptional 98.2% |
| Chippewa | 100.0 /100 | #32 | Exceptional 98.1% |
| Swiss | 100.0 /100 | #33 | Exceptional 98.1% |
| Chinese | 100.0 /100 | #34 | Exceptional 98.1% |
| Italians | 100.0 /100 | #35 | Exceptional 98.1% |
| British | 100.0 /100 | #36 | Exceptional 98.1% |
| Latvians | 99.9 /100 | #37 | Exceptional 98.1% |
| Belgians | 99.9 /100 | #38 | Exceptional 98.1% |
| Luxembourgers | 99.9 /100 | #39 | Exceptional 98.1% |
| Eastern Europeans | 99.9 /100 | #40 | Exceptional 98.1% |
| Hungarians | 99.9 /100 | #41 | Exceptional 98.0% |
| Northern Europeans | 99.9 /100 | #42 | Exceptional 98.0% |
| Ottawa | 99.9 /100 | #43 | Exceptional 98.0% |
| Aleuts | 99.9 /100 | #44 | Exceptional 98.0% |
| Czechoslovakians | 99.9 /100 | #45 | Exceptional 98.0% |